Stormwater Preprocessing and Analyses in ArcGIS Pro
March, 2023
Download the PDF here
Executive Summary
Arc Hydro concept and base data model have supported stormwater analyses from the inception in 2002. Stormwater representation is a combination of surface drainage and connectivity defined by built infrastructure that often redirects and alters surface drainage. Early development of Arc Hydro tools in cooperation with Southwest Florida Water Management District focused on detailed representation of such complex drainage systems based on availability of high-quality DEMs and asset inventory with the ultimate goal of supporting detailed integrated hydrologic and hydraulic models operating on such systems.
The biggest problem with stormwater implementation was historically the level of details that is needed to capture the intricacies in stormwater flow, both for the overland and built flow patterns. For a reasonable representation, high quality DEM and stormwater asset inventory is needed. Without both, attempts to build a viable stormwater system representation are not feasible.
Availability of high resolution DEMs (1m cell size or better) and better quality of stormwater infrastructure assets make automation and analysis more viable. The Arc Hydro team has supported several efforts in the past few years focusing on stormwater representation within Arc Hydro context focusing on representation of general flow patterns as opposed to detailed flow modeling. In a nutshell, the focus is on establishing the stormwater system representation that allows the user to perform basic upstream (watershed area) and downstream (flow path) analysis from any point in the landscape based on minimal stormwater and terrain informational content.
This document describes the implementation of stormwater representation within the Arc Hydro framework based on these more general requirements and additional Arc Hydro tools and workflows that have been developed to handle stormwater special cases.
This document is organized around a normal processing workflow:
Data review and organization. In this step, the local data are organized into a consistent database structure containing only the pertinent data for the analyses.
Data evaluation and cleanup. Problems in original analytical data are identified and fixed (automatically and/or manually).
Data preprocessing. Establishing the necessary Arc Hydro analytical vector and raster infrastructure.
Analyses. Running two specific stormwater tools.
Tools and process automation. Location of the tools and workflow overview.
Database design. Basic description of layers created during data preprocessing.
Document history
Table 1. Document Revision History
| Version | Description | Date |
|---|---|---|
| 1 | First Version (CD) | 10/03/2017 |
| 2 | Additional review step after Create Sink Structure (CD) | 11/10/2017 |
| 3 | Complete update and rewrite (DD & CD). Inclusion of latest tools and updated workflows. | 1/11/2019 |
| 4 | Update for ArcGIS Pro (CD). | 3/24/2023 |
Data review and organization
When establishing the initial stormwater analytical dataset (network), the key is to identify stormwater infrastructure that participates in the water collection and conveyance. This includes:
Stormwater inlets that allow the surface water to enter the pipe system.
Pipe system that conveys water but does not collect it.
Open channel system that both collects and conveys water.
Often, stormwater infrastructure is not organized from this perspective. For example, a typical manhole feature class can include both manholes that are completely covered and do not allow water to enter the stormwater system as well as manholes with grated cover that do allow entry of the surface water. Similarly, inlet features that allow water to enter the system can be stored in multiple feature classes.
One of the first steps in building the representative Arc Hydro stormwater infrastructure is to identify which feature types play the three identified roles in Arc Hydro and organize those features into the three specific feature classes (part of the same feature dataset) for further use. This is performed to streamline the use of the tools and clearly separate data roles. The original infrastructure data will also be augmented during the terrain processing, so keeping the original infrastructure data separated from the "analysis" data is an important design consideration. It is important to note that this "duplicates" some of the infrastructure data, so appropriate data maintenance workflows need to put in place so that the data are in "sync" (through well-defined data editing and update procedures).
Initial infrastructure data are organized into four feature classes:
HydroJunction - combined inlet features.
Pipe - combined closed conveyance features.
StreamInit - combined open conveyance features.
PipeOutlet - known structures that let water onto the surface. May be derived.
Note that at this point a single database design (attribute) structure was not enforced for these feature classes - the attributes from individual contributing feature classes can be "combined" when the features are merged. This generates an inefficient data model that can be streamlined later. Once the improved data model is established, when moving original infrastructure data into this model a proper attribute transformation/population should be performed. The most important aspect of this attribute transformation is inclusion of key identifier that allows for linking of the data between the original infrastructure database and the Arc Hydro analytical geodatabase.
Naming of input and output layers (as presented in this document) is not critical - user can use their own naming conventions and specify those names when running the tools as long they are used consistently. Maintaining consistent and default names helps though with process quality control and tool use (as you do not have to explicitly specify inputs and outputs but just accept defaults when they are provided).
Data evaluation and cleanup
This section presents a basic discussion of data quality requirements and some of the methods and tools for their evaluation and adjustments. While the requirements are not complicated, getting the typical data to conform to those requirements will represent the bulk of the effort in a stormwater implementation and will require an iterative data development and review process. Experiences from this exercise should be incorporated in the data maintenance and collection workflows so that new data comply with the requirements and do not require additional adjustments.
Note that significant effort can go into snapping and orienting open channels, pipes, and inlets into a topologically "clean" dataset that can be used for tracing after the initial data are imported into the three basic stormwater feature classes. Even larger effort might be needed if complete infrastructure data are missing, and fieldwork must be performed to collect them. The level of effort will also be end goal driven. For example, if the end requirement is to establish drainage areas draining to outfalls from 48" pipes or higher as opposed to hydraulic modeling of the full system for design purposes, a different data content design/evaluation/augmentation strategy can be implemented.
There are three key elements that must be correctly represented in the final stormwater system:
Feature content. Line and point features representing built infrastructure need to be in proper places (fill in the gap in missing features).
Connectivity.
Inlets need to be snapped on the from node of a pipe.
Pipes and streams need to be snapped onto each other.
Directionality. Pipes and streams need to be oriented "downstream" (for predominant flow direction in the system - disregard potential surcharging of the system).
Figure 1 presents some of the issues with the typical dataset. Thin black lines represent lateral pipes, thick black lines represent main pipes, blue lines represent open channels/streams, points represent inlets, and arrows are placed at the downstream end of the linear features indicating the direction of "flow".
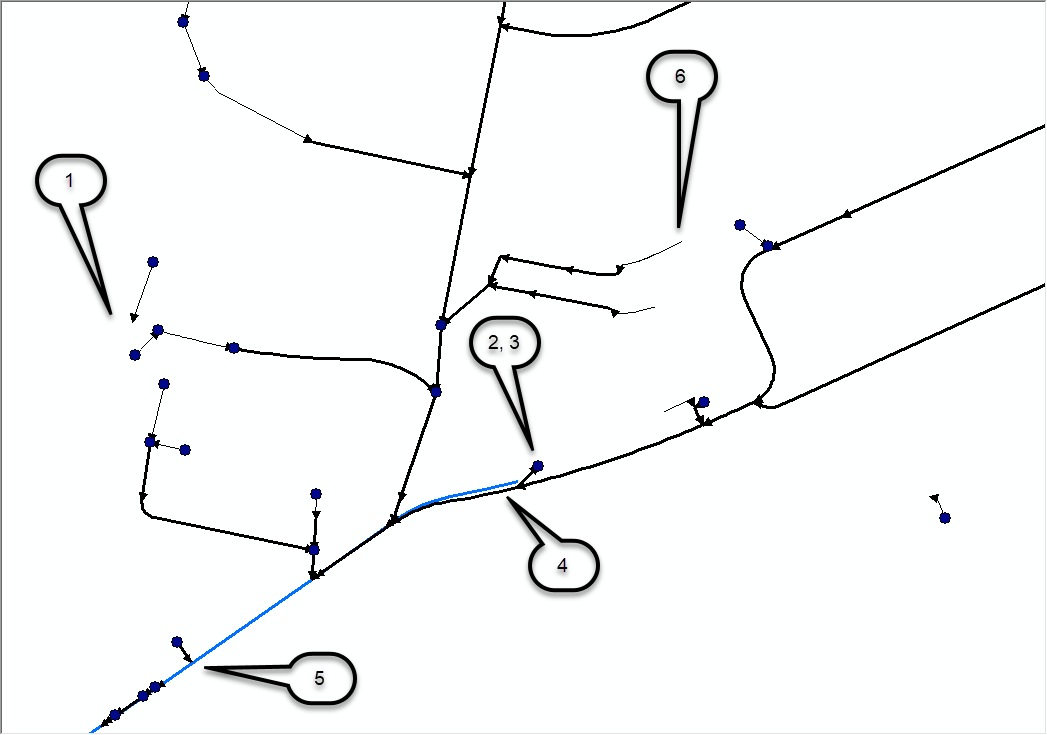
Potential lack of connectivity. Lateral is not connected to anything. This is not necessarily a problem if the pipe outlet is emerging onto the surface but is a problem if this is a completely underground pipe.
Incorrect direction of flow in the pipe.
Inlet placed at the outlet of the pipe.
Potentially misaligned pipe and open channel feature.
Simple connectivity not maintained between linear features (blue line should be split at the location of the confluence).
Potential lack of inlet at the top of the pipe. This is not necessarily a problem if the pipe inlet is at the surface but is a problem if this is a completely underground pipe.
Any standard data evaluation and editing tools can be used to build a topologically clean dataset. Ideally, these requirements would be introduced early in the data development cycle, so that the asset data brought into this system do not have "problems". Following is a summary of types of issues addressed in this document (a 1m cell size DEM is assumed to be available to support the analysis, but this is not a "hard" requirement).
Remove all inlets that are not connected to a pipe (unless the inlet represents a known terrain sink).
Add inlets to all head pipes that do not already have an inlet.
Create outlets at stream ends and add them to inlets (they will be modeled as sinks). If disconnected streams are to be connected to the rest of the network by overland connectors, do not add the created stream outlets to inlets.
Create surface outlets at all pipe outlets (NDID = -1) that do not already have an outlet (isolated pipes will be connected to the network by overland connectors).
Check all inlets that are 3m from a stream. Manually adjust if necessary (no manual adjustment was done in the example).
Check all inlets that are 3m from other inlets. Manually adjust if necessary (no manual adjustment was done in the example).
Delete all explicit outlets that are not connected to a pipe.
Build a network from pipes and streams and check for glaring gaps in connectivity and directionality. Note that additional connectivity will be established later on by creating the overland connectors that will be added as "streams".
Initial database organization
The standard Arc Hydro database/project organization is used.
Select the projection system to use in the project (usually based on DEM). Do not use unprojected coordinate system. Both raster and vector data must be in the same coordinate system, so if the original data are not (or are unprojected), decide which system to use based on broader project requirements.
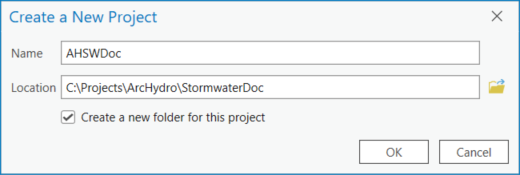
Open a new ArcGIS Pro project using the Map template. Browse to the location where you want to store your project and specify the name of your new project folder. Click OK. A new project folder and default geodatabase are created.
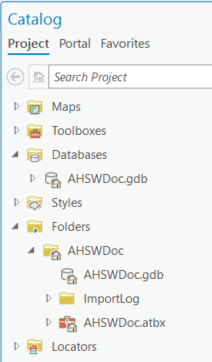
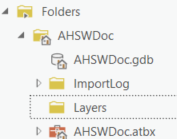
- A subfolder "Layers" is created in the project folder. This will be used to store all the raster data.
- A feature dataset called "Layers" is created using the selected spatial reference.
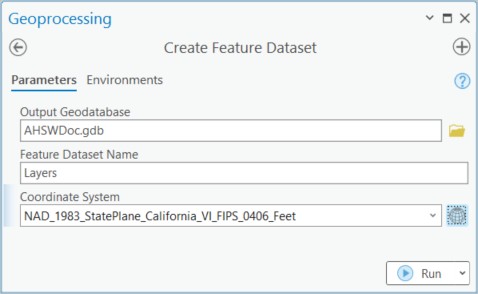
The following data are imported from the original infrastructure geodatabase into the feature dataset:
Original open channel/surface drainage layers are consolidated and named "StreamOrig".
Original pipe layers are consolidated and named "Pipe".
Original inlet layers are consolidated and named "HydroJunction".
DEM is clipped to a rough outline (watershed) around the vector data and is named "DEMAOI.tif". It is stored in TIFF format and stored in the "Layers" folder under the parent folder. If necessary, it is projected in the project's projection and if later used for landscape characterization, vertical units are adjusted to match the horizontal units.
The project DEM is added into the map first, BEFORE any other layer, so that it sets the projection of the map.
Additional vector and base data can be added, and the project saved.
Data cleanup
This section presents a general overview of the data cleanup process.
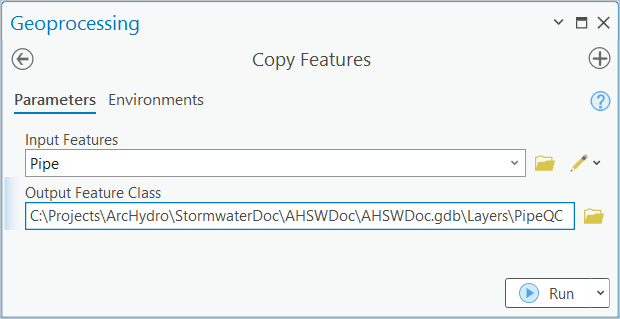
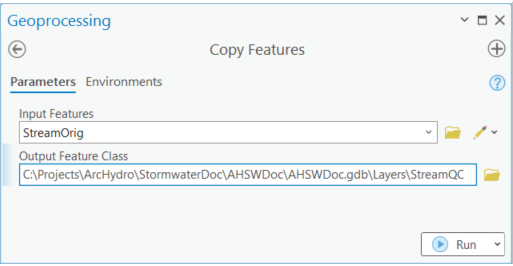
1. Checking for glaring issues in linear features
This is a quality control step that should be performed early on when the data are received, and their quality is uncertain. The final trace network representing full stormwater system will be built later on after the overland connectors are built (if necessary), so this is performed here to do a "coarse" check on the stream and pipe data before detailed processing is started.
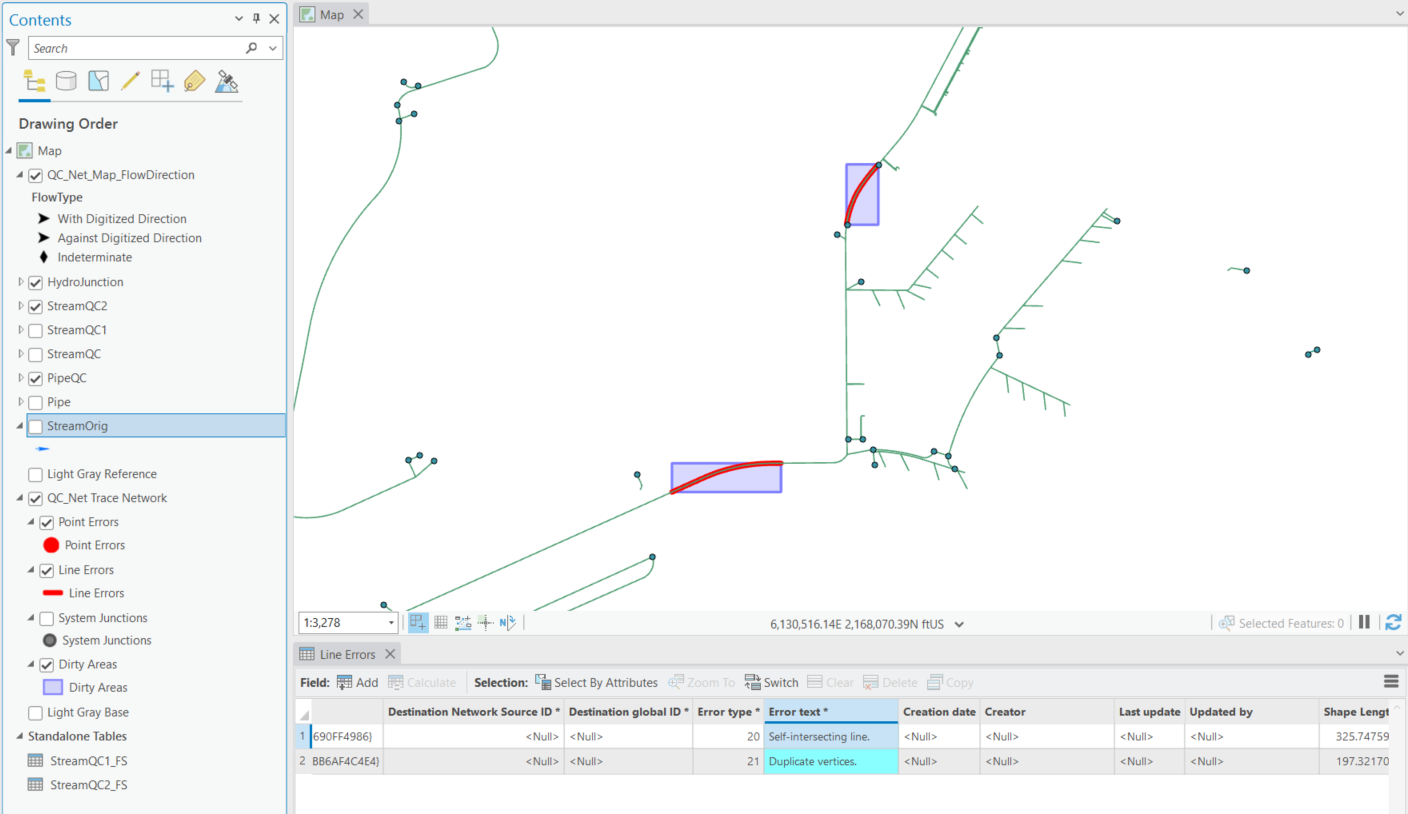
1.1 Build a QC network
It is strongly suggested that the QC and editing operations are performed on the copy of the data until all the quality issues are resolved.
To build a good trace network, initial data screening should be performed to eliminate known issues before building the network. Some of the more glaring issues include:
0 (or very short) length features.
Multipart features.
Coincident/overlapping/duplicate features.
These issues should be reviewed and fixed using any editing means. The following steps are presented here as an example of what typical operations might include but are not exhaustive by any means and do not include any manual editing that might be required in a production situation. They include a mix of standard and Arc Hydro geoprocessing tools.
Multipart to singlepart conversion.
Removing of pseudonodes.
Splitting and connecting pipes and streams.
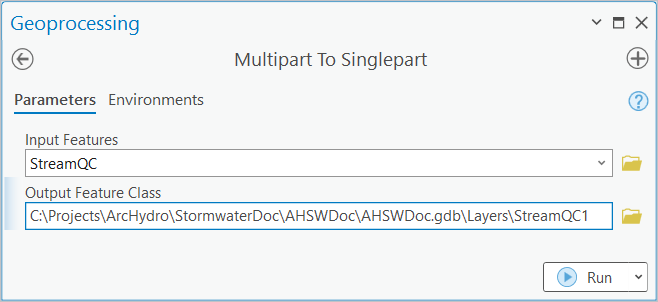


After running this tool, it is possible that fewer but longer stream segments remain. 0.1m snapping tolerance will be used when building the network to accommodate potential lack of enabled snapping when features were originally created. If snapping was enabled, network snapping tolerance can be skipped (0 by default).
1.1.1 ArcGIS Pro - Build a QC Trace network
Review the Point Errors and Line Networks and fix them as appropriate. You can reference the standard documentation for the Trace Network to resolve the issues.
1.2 Use network for testing
Place a network "flag" on points of interest and trace upstream. This can be done by using the Trace Locations Pane accessible in the Trace Network tab by selecting Trace Locations > Set Trace Locations.
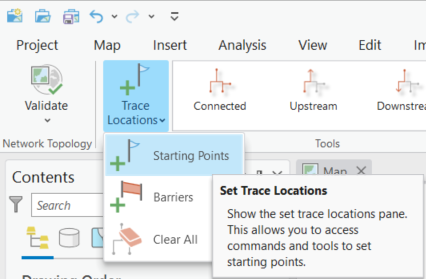
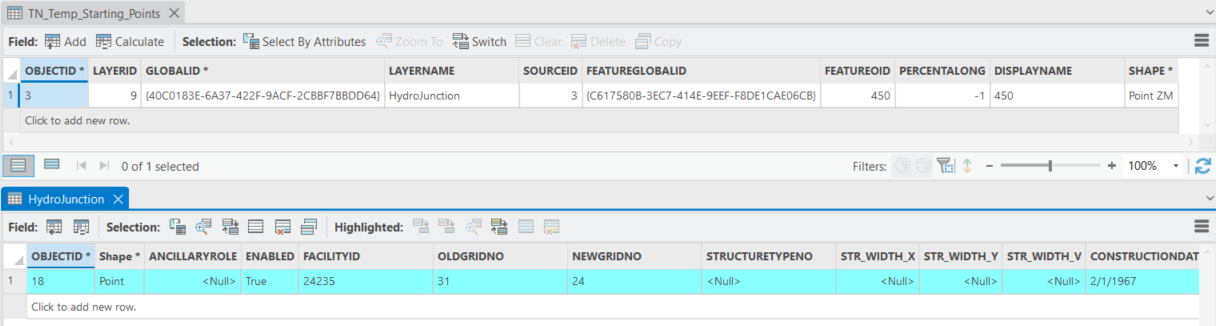
In the Pane, click Add features and click on the map at the location where you want to place the flag. The flag is displayed as a green circle on the map and the name and identifier of the associated network feature is displayed in the pane. The flag is stored in the point layer TN_Temp_Starting_Points located in the default geodatabase.
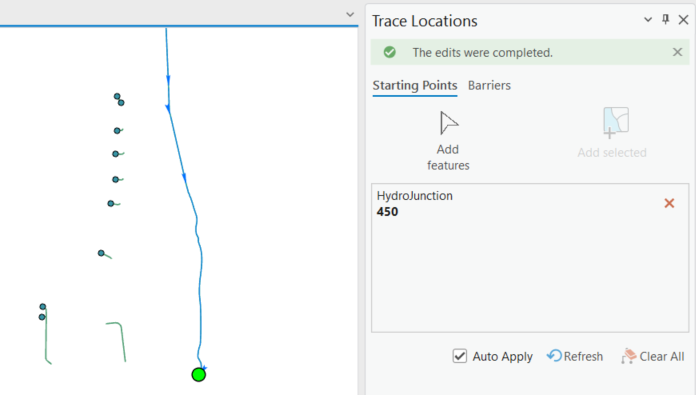
Typical points of interest should include major outfalls. Lack of connectivity indicates "missing" elements in the system (missing pipe/stream segment, elements not properly snapped, and wrong digitized direction). After the above fixes to the data, the same outlet point shows much larger connectivity and includes many pipe sub-systems contributing to the open channel flow.
Note that later in the process we will generate "overland flow connectors" that will connect isolated subsystems into a connected system based on DEM-derived connectivity.
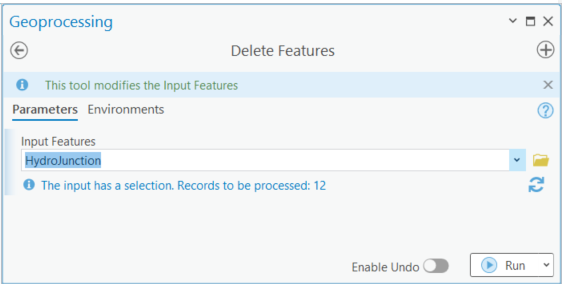
Once the initial network analyses are done, you can delete the trace network.
In the further processing, the edited linear features will be used.
2. Review and remove all inlets that are not connected to a pipe
Unconnected inlets will generate "sinks" that are not connected to anything and as a consequence that will exclude area contributing to those features to contribute anywhere to the system. That IS possible, so such inlets should not be deleted. In most cases though, these indicate missing pipe information.

In a typical data scenario, several inlet features might not be connected to a pipe. Note that some of the inlets are probably in a right place, but the connection pipes are missing. These instances should be investigated and fixed.
3. Add inlets to all head pipes that do not already have an inlet
This is a data augmentation step - if not performed, these pipes will not carry any flow (which might be correct, but makes them redundant in the analytical system).
3.1 Characterize pipes
Assigning HydroID is needed only if not already performed as part of other data processing.
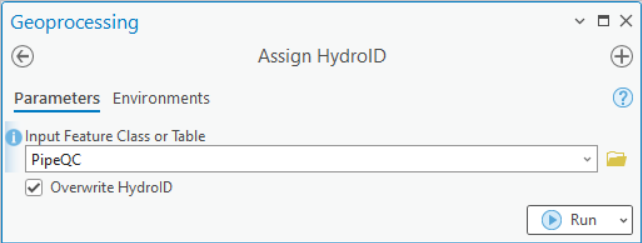

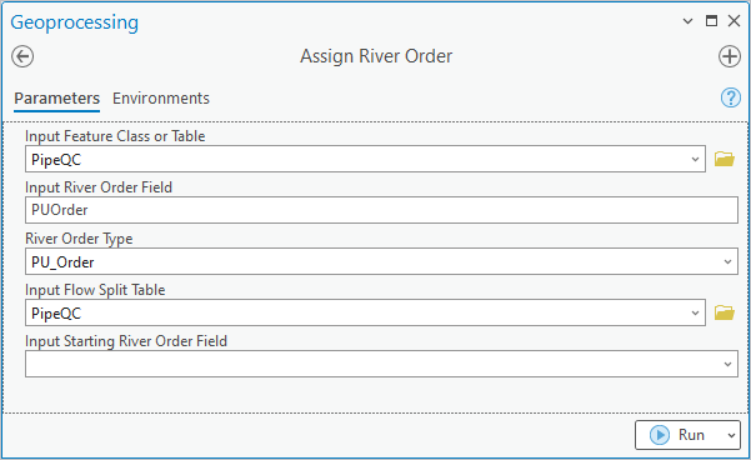
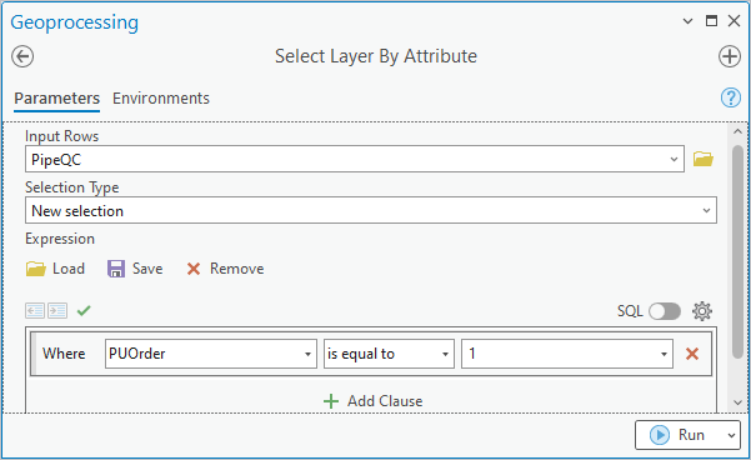
3.2 Select head pipes
Head Pipes have a PUorder equal to 1.
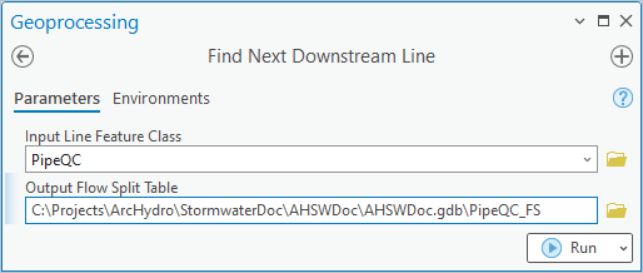
3.3 Create synthetic inlets
Synthetic inlets are created at the starting point of the selected head pipes by using the Feature Vertices to Points tool. Note that this tool requires an Advanced license.
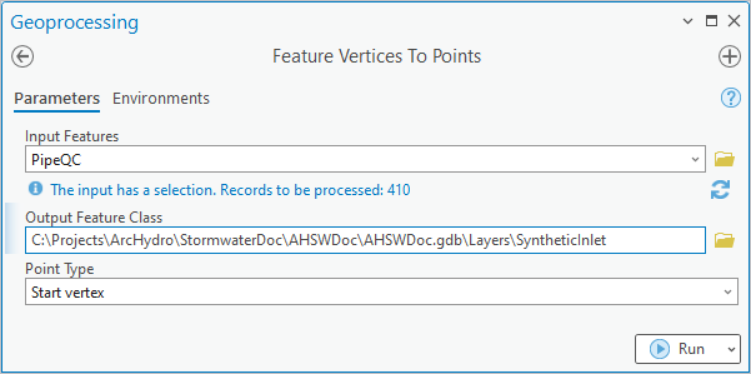
It is possible to generate coincident inlet features since there are cases where two or more pipes have the same origination point. The duplicates need to be deleted. In a normal data QC workflow, these cases should be identified (you can use the tool "Find Identical" which requires an Advanced license for that), reviewed, and edited manually if necessary.
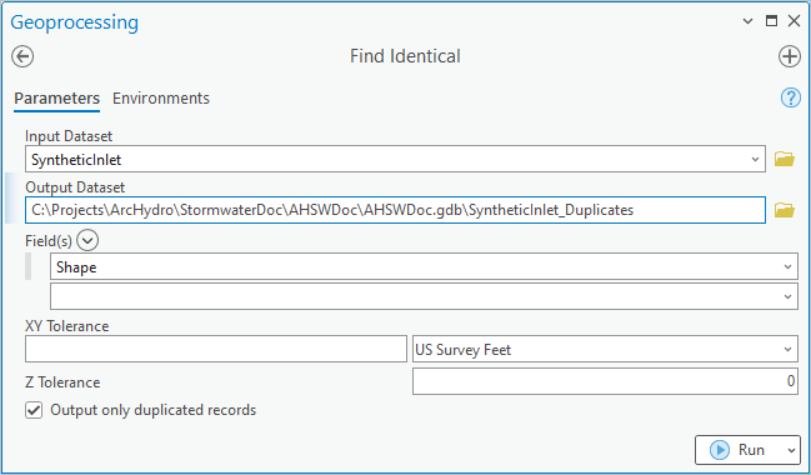
If identical features are found, they may be deleted with the Delete Identical tool (Advanced license).
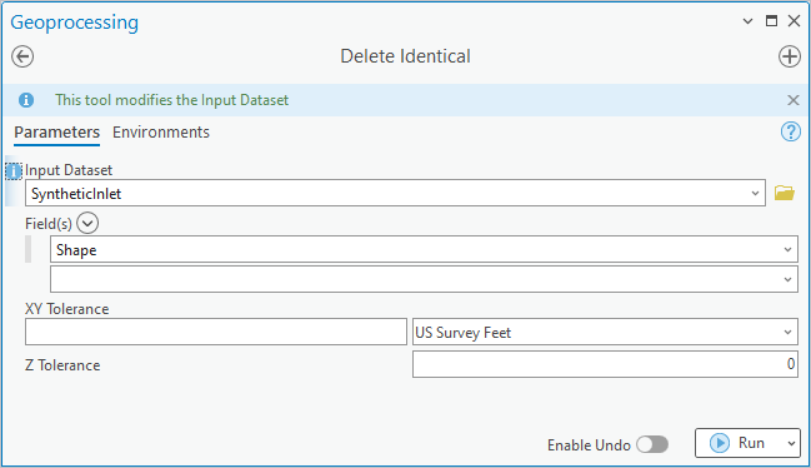
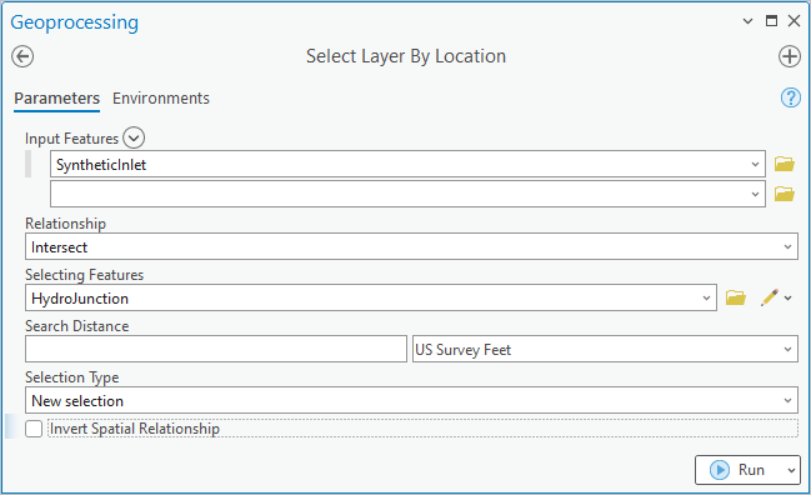
Synthetic inlet points can already have inlet structures associated with them and are thus not needed. They will be deleted.

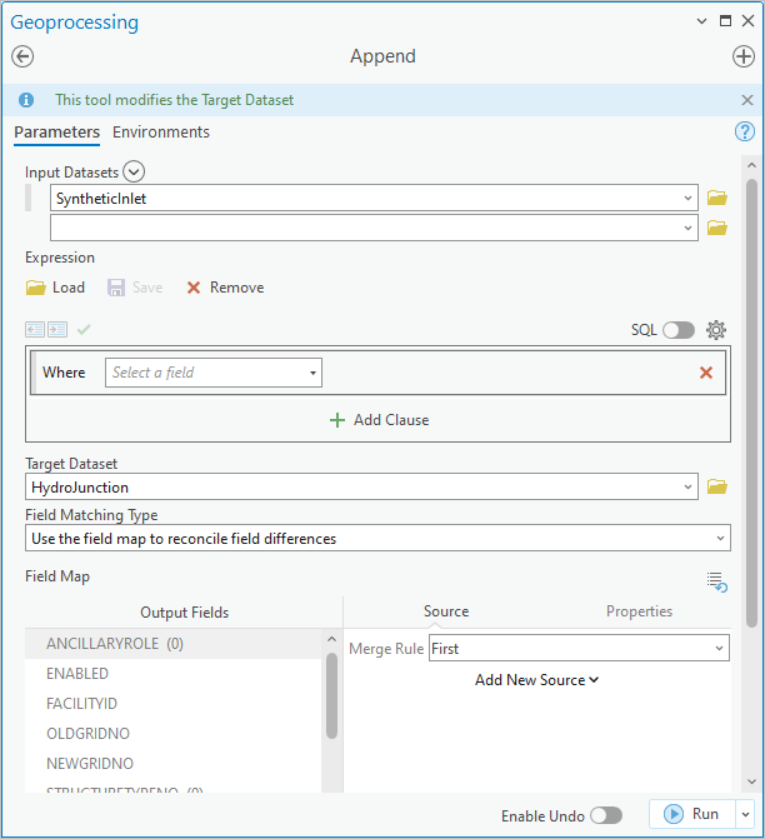
3.4 Append synthetic inlets to HydroJunction
The remaining SyntheticInlet features are appended to the other valid already stored in the HydroJunction feature class.
4. Create stream outlets and add them to HydroJunction
Stream outlets (end points of streams not connected to other streams) can happen in three circumstances:
Error in data - the connecting element is missing. If that is the case, it should be noted during initial quality control of linear features and fixed by digitizing the connector (see option for automated fixing discussion later on).
The stream segment actually ends in a sink (depression) and does not flow further downstream.
The stream segment ends in a pipe structure (e.g., culvert). In this case, the end of the stream is the beginning of a pipe, and those are modeled as sinks, so effectively, this is the same as case #2.
In this exercise, we will work under the assumption that these locations are represented as sinks in the system (case #2 or #3). See text inserts if case #1 is to be implemented.

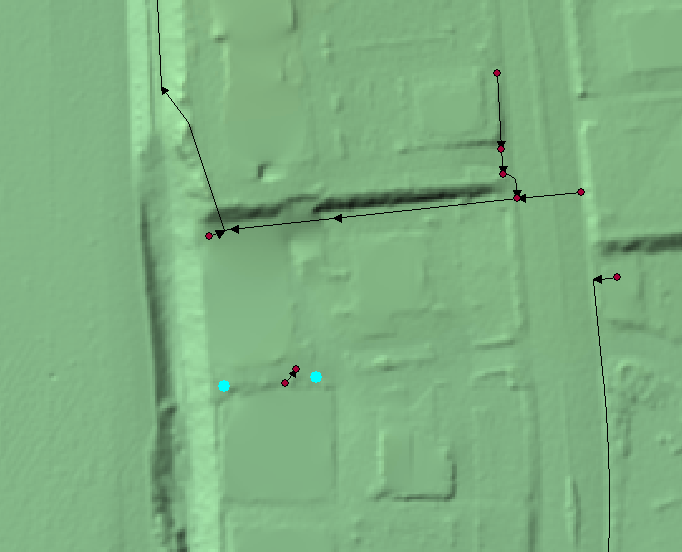
Several stream "outlets" are identified. They are at expected places. Few might require addition of overland paths but in this example, they will be treated as "real" sinks.
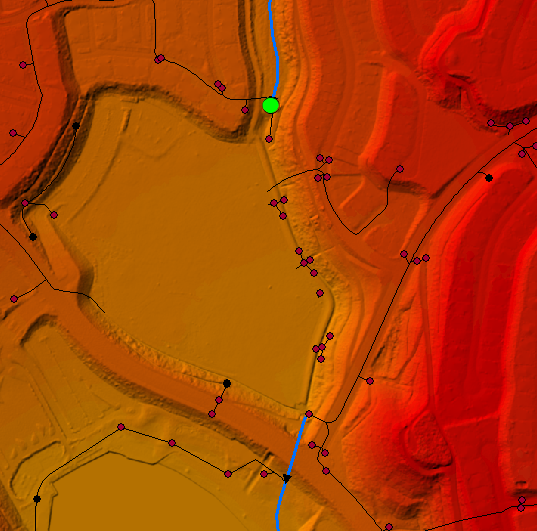 |  |
Select stream outlets that are not represented in the HydroJunction feature class and add them to it.
In this case none of the outlets coincide with pipe inlets and all will be added to the HydroJunction feature class.

5. Check all inlets that are close to a stream or another inlet
Inlets in the current data processing workflow are modeled as sinks (to "attract" water to flow into them). Sinks are defined as polygons and constructed using a ~2-cell buffer around the inlet point. Proximity of inlets to a stream thus can generate unexpected behavior. The inlet that is in/too close to the stream will be treated as if the inlet defines a pipe divergence that is in the stream. The consequence will be that the "sink watershed" for that inlet will include upstream surface area that is drained by the stream the inlet is in. If that is not the desired behavior, move the inlet point more than 2 cells away from the stream.
A similar issue exists when two inlets are close to each other since they will be collapsed into a single sink polygon.
Note that in the following example, the optional search distance is set to 10m to limit the operation time but also to look at a few more features than just the ones within the sink polygon buffer distance. This can be controlled based on QC requirements.

The result provides the fields with measurement of distance (NEAR_DIST) and proximity match layer name (NEAR_FC). Distance field will contain the distance to the closest stream or inlet feature (value of -1 indicates that the point is NOT within a search distance from any feature). Note that the distance is in layer units (e.g., feet), not in the "query" units (e.g., meters).

v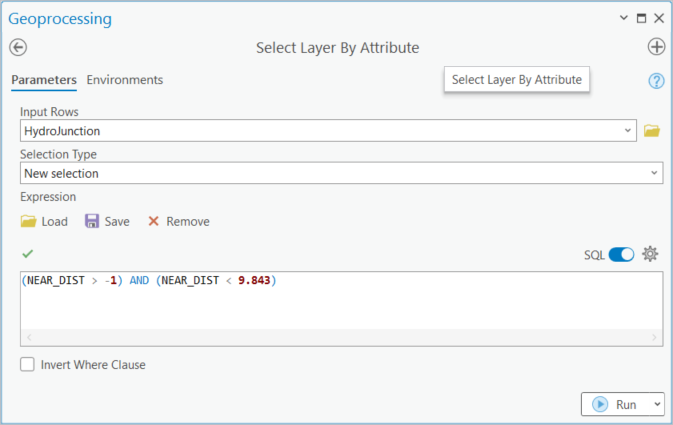
Many inlets are selected based on proximity of 3 m. The results should be reviewed, and appropriate data editing performed to resolve any inlet distance issues.
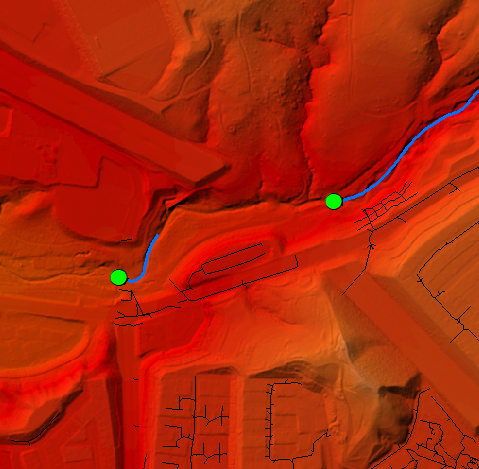
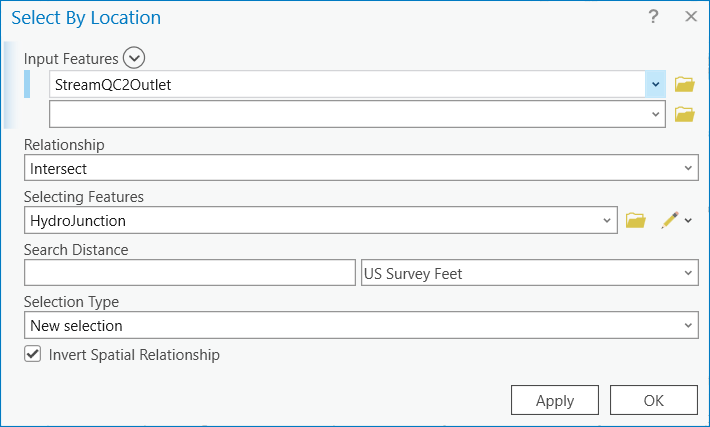
6. Check all explicit outlets that are not connected to a pipe
This is just a quality control step to identify if the pipes that are supposed to end at those outlet locations are potentially missing. It is possible that the pipe outlet features are not explicitly known (pipe outlets is an optional feature class), so this check might not be possible to perform.
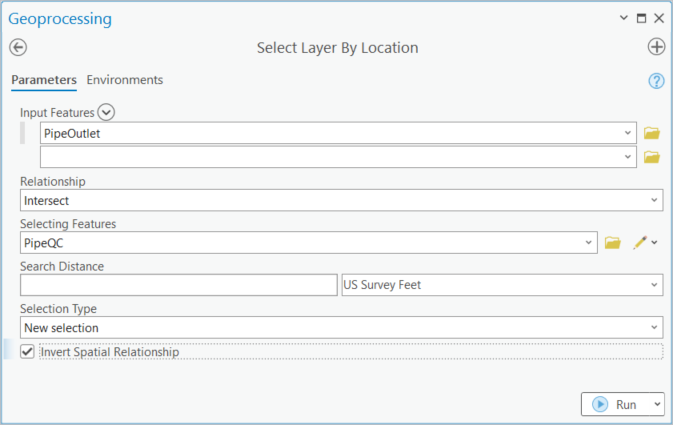
In this example, many discharge points are not connected to the pipes. Two are highlighted in the figure below. In this example, no additional pipes have been added based on this review.
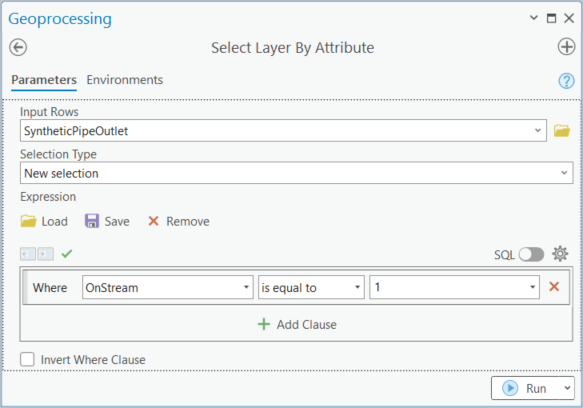
7. Create surface outlets at all pipe outlets that do not already have an outlet
Note that in this example we will not really review which end of pipes have and do not have an outlet structure. We will work under the assumption that any pipe outlet needs to be connected to the stream, either by already being on the stream or by creating an overland stream connector. In a normal QC process, a more thorough investigation and possibly manual editing should be performed.
The resulting feature class will have an attribute called "OnStream" where value 0 indicates that the outlet point is not on the stream and 1 indicates that it is. To ensure that the stream segments are split on the connection points with pipes (to ensure the consistency of the trace network), the streams will be split at the connector points.

Final thoughts on data evaluation and cleanup
Steps presented in this chapter were just some of the possible techniques for data review, cleanup, and augmentation. They were presented here not as something that MUST be performed or the ONLY way of performing these activities, but rather as some of the viable options to perform them and to highlight Arc Hydro tools that were developed to support these activities. The actual work that will need to be performed on the data will vary greatly depending on the provenance of the data and the robustness of the data editing workflows used to develop them. Each local dataset is unique and specific steps will have to be developed to accommodate nuances of the specific dataset.
Data preprocessing
This section identifies individual terrain processing steps after the initial data QC, editing, and creating has been performed. The following layers are used in the process:
| # | Description | QC process result name | Preprocessing workflow name |
|---|---|---|---|
| 1 | DEM | demaoi | |
| 2 | Pipes | PipeQC | Pipe |
| 3 | Streams | StreamQC3 | StreamInit |
| 4 | Inlets | HydroJunction | HydroJunction |
| 5 | Outlets | SyntheticPipeOutlet | PipeOutlet |
Column "QC process result name" are names of the layers if you followed the steps described in chapter 3. Column "Preprocessing workflow name" has the layer names that will be used as initial inputs in this chapter.
1. Processing data organization
To ensure consistency of the layer naming in the next steps, current layers that do not match "workflow name" in the table above will be renamed into it. While not necessary, a new folder and geodatabase is created that contains only the relevant renamed layers. To make this as generic as possible, there is not assumption that any previous Arc Hydro processing has been done with the data (so the layers do not need to have HydroID, etc.). Since no specific attributes, besides the ones generated during the process are used, all current attributes on the four feature classes can be deleted if desired. As discussed before, it is suggested that the original unique identifiers of the data elements are preserved to enable link back to the original feature if need arises.
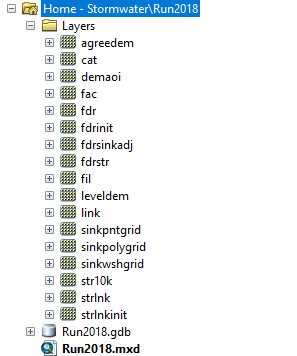
The initial processing folder/data structure is as follows:

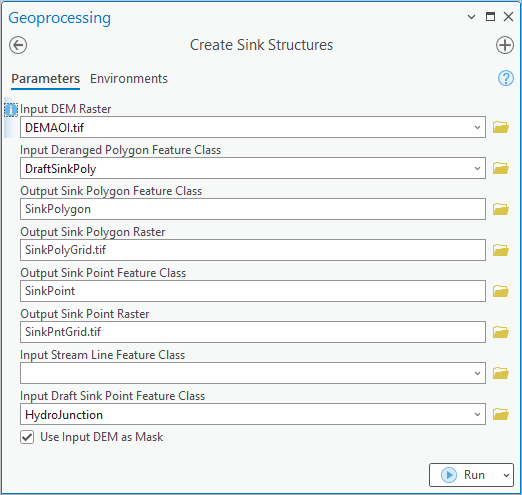
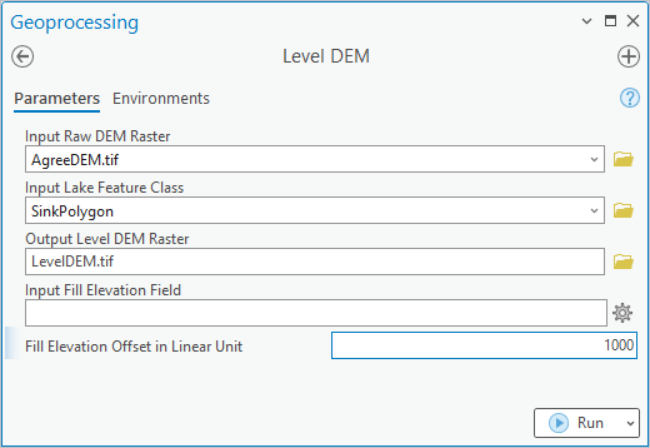
2. Create sink structures representing inlets
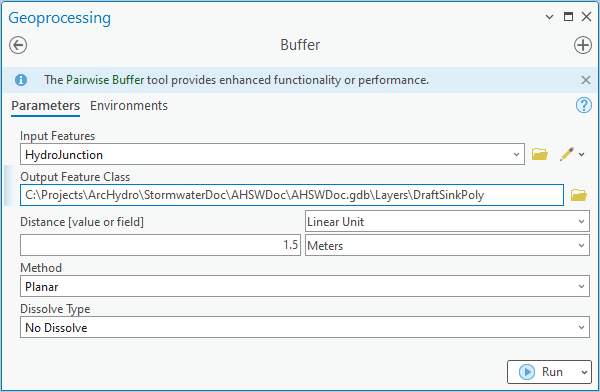
This step is used to generate artificial sinks at inlet locations to "force" the terrain to flow into the inlets.
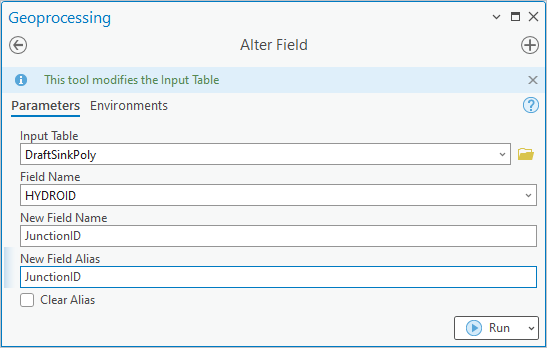
2.1. Create draft sink polygons
There are several ways to generate "sink polygons" associated with inlets. A buffer approach is presented here. A buffer of 1.5 times the cell size around the inlet is used (in this case 1.5m). The presented buffer distance is a minimum that can be used. It is possible that such a small buffer will not generate a "sink" big enough to resolve DEM inaccuracies around inlets and a larger buffer might be appropriate. This can be evaluated once the sink watersheds are established. It is possible to have a point-specific buffer distance that varies throughout the system. In that case, establish a field in the HydroJunction feature class and populate it with the buffer distance to be used in the buffer function. Then use that field to define distance value in the "Buffer" function.
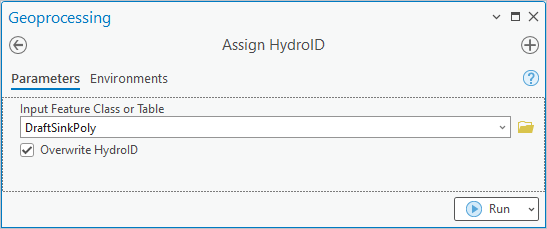
Assign HydroID to HydroJunction features if necessary (if not performed somewhere earlier in the data development process).

2.2 Create sink structures
This step generates sink representations (vector and raster) matching underlying DEM resolution that will be used in the processing.
2.3 Sink point review #1
Notice that several points fall into a single sink polygon (the tool message will identify if multiple points fall within a single sink polygon and how many in total were deleted). This happens due to the point proximity with respect to the DEM cell size and buffer distance being used to generate sink polys. The tool will select one of the points within sink polygon and ignore the others. While not necessarily an error, this might generate unexpected results (e.g., one inlet collects all the water from the sink), and a detailed QC of those points is suggested (but not needed if the end results are acceptable).
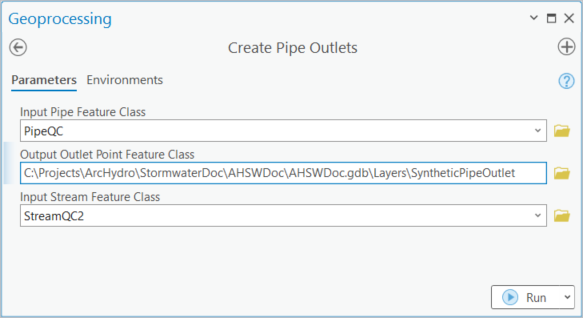
3. Create drainage line structures representing open channels
This step generates stream representations (vector and raster) matching underlying DEM resolution that will be used in the processing.
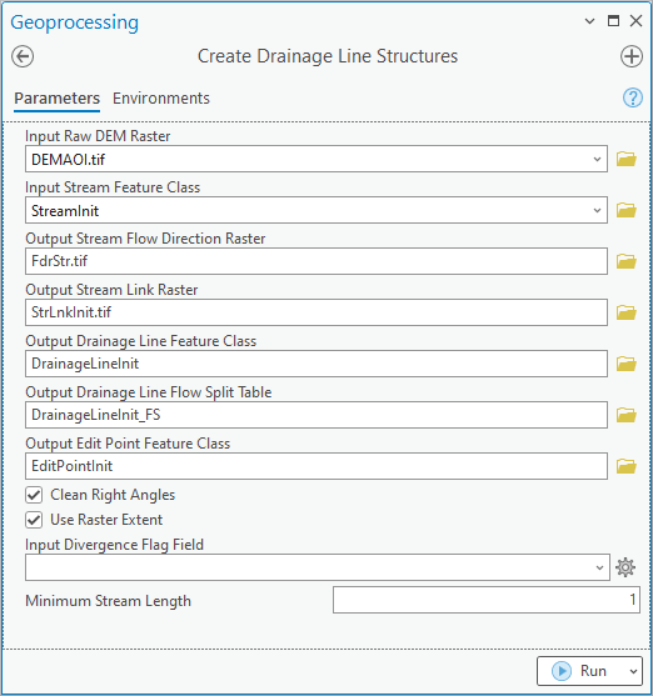
Notes
HydroID field will be created and populated by the tool if one does not already exist.
Use of non-standard output names for some of the layers ("Init").
3.1 Sink point review #2
The following section deals with evaluating the possibility that a sink point resides on a stream.
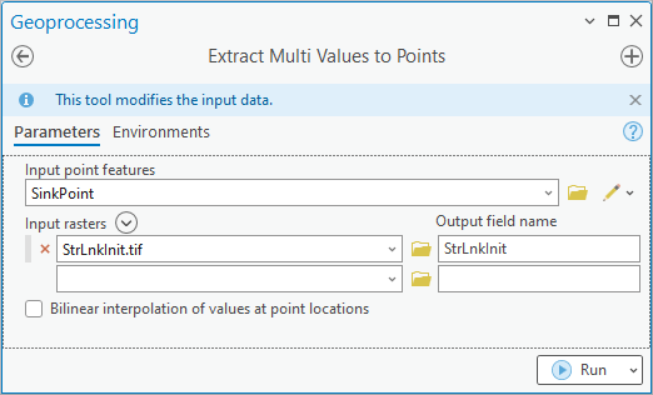
Review the field "StrLnkInit" in the SinkPoint feature class. In this case, there are 12 points with a value. This indicates that an inlet point (sink) is located on a stream cell. By reviewing these points, three categories can be identified:
End of stream sinks. 9 of them. These were introduced on purpose and are correct.
Cross-pipe (divergence - inlet at the from node of the pipe). 1 of them. These are most likely data errors and need to be reviewed. Can potentially introduce unexpected behavior in the flow pattern.
Confluence (confluence - inlet at the to node of the pipe). 2 of them. No significant impact. Can potentially introduce unexpected behavior in the flow pattern.
Upon review, if data need to be fixed (e.g., remove the inlet point or stream), they should be fixed, and previous steps re-run. How many steps need to be re-run will depend on the changes made. In this example, no fixes were made.
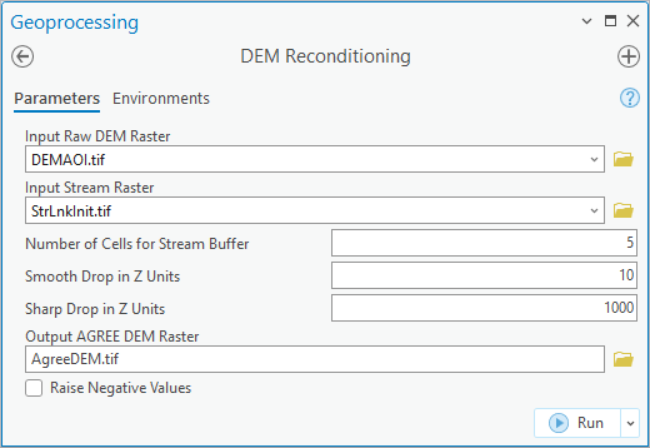
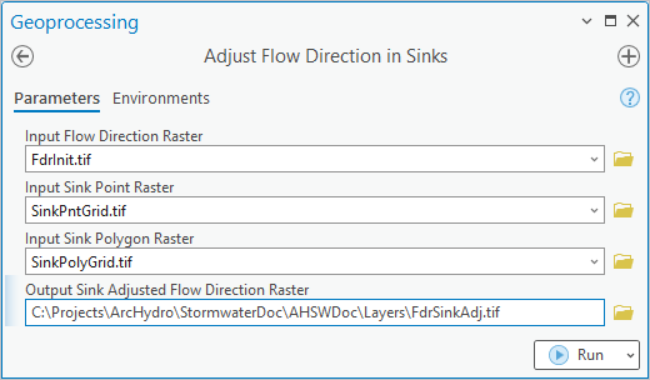
4. Adjusting DEM to enforce initial flow direction
Note that "Input Stream Raster" is a result of the "Create Drainage Line Structure" function.
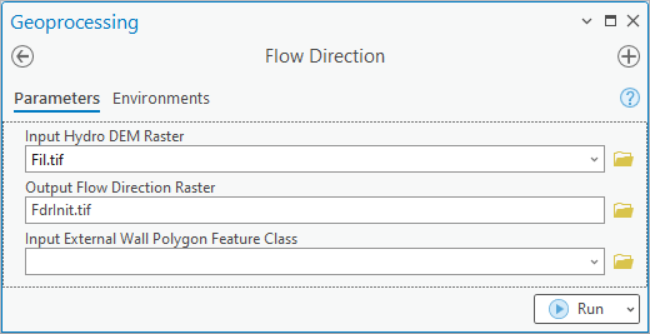
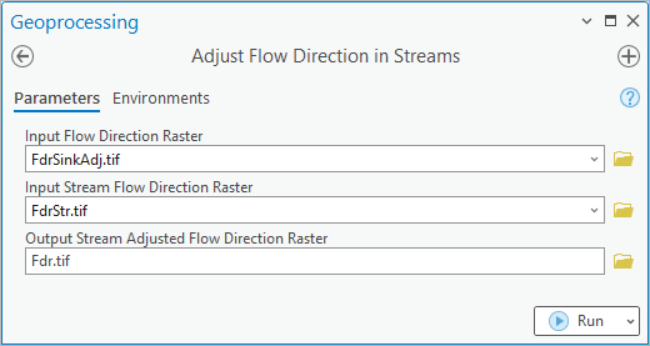
5. Establishing flow direction
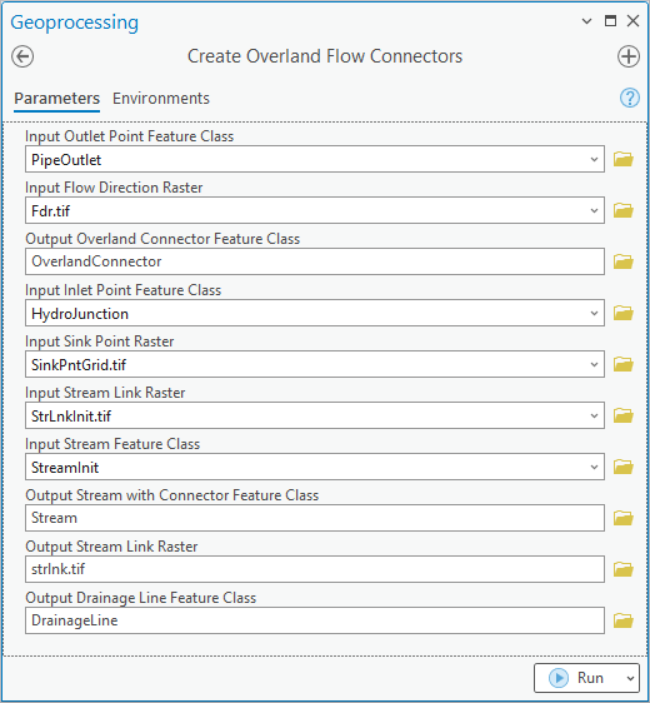
6. Create connected linear system
The following function is used to generate "missing" overland flow connectors (usually ends of pipes discharging onto a surface) and connect them to the existing stream features and/or downstream inlets/sinks.
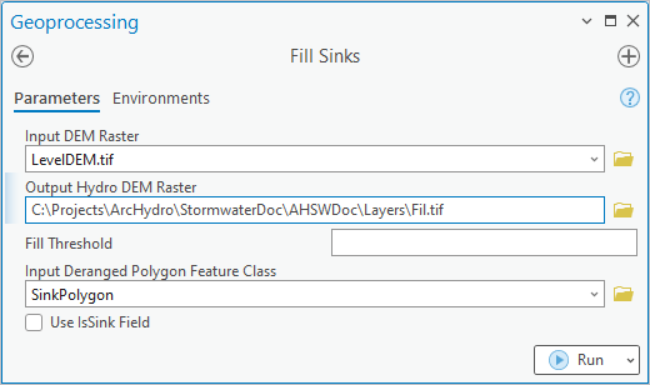
7. Create drainage area elements
Sink watersheds represent total directly contributing surface contributing area to a sink. They will be the same as the sink catchment unless there is a stream draining directly into the sink.
The following step is performed to ensure performance of the watershed delineation tool (even when processing inland areas). It is not needed if the DEM is clipped exactly along the major watershed boundary that defines AOI.
8. Build stormwater system
This section presents several steps for completing the stormwater system (building final connected network) and generating supplemental layers to facilitate stormwater delineation.
The following two steps are performed to establish a flow accumulation raster and a snap stream raster (to facilitate precise placement of points of interest when performing watershed delineation). These are optional steps but are recommended.
A threshold of 10,000 cells (10,000 m2) was used here. This can be changed to get more or less dense (bigger threshold) snap density.

Analyses
Once the stormwater system is built, it can be used to support different analyses. Two specific tools are built to leverage the stormwater system data representation.
Stormwater delineation
This tool allows watershed delineation along the stormwater system. Three types of watershed delineation are possible: full delineation, direct surface contribution, and simulated inlet location (check tool help for detailed discussion on how each delineation type operates). To use the tool:
- Open the "Stormwater Delineation" tool.
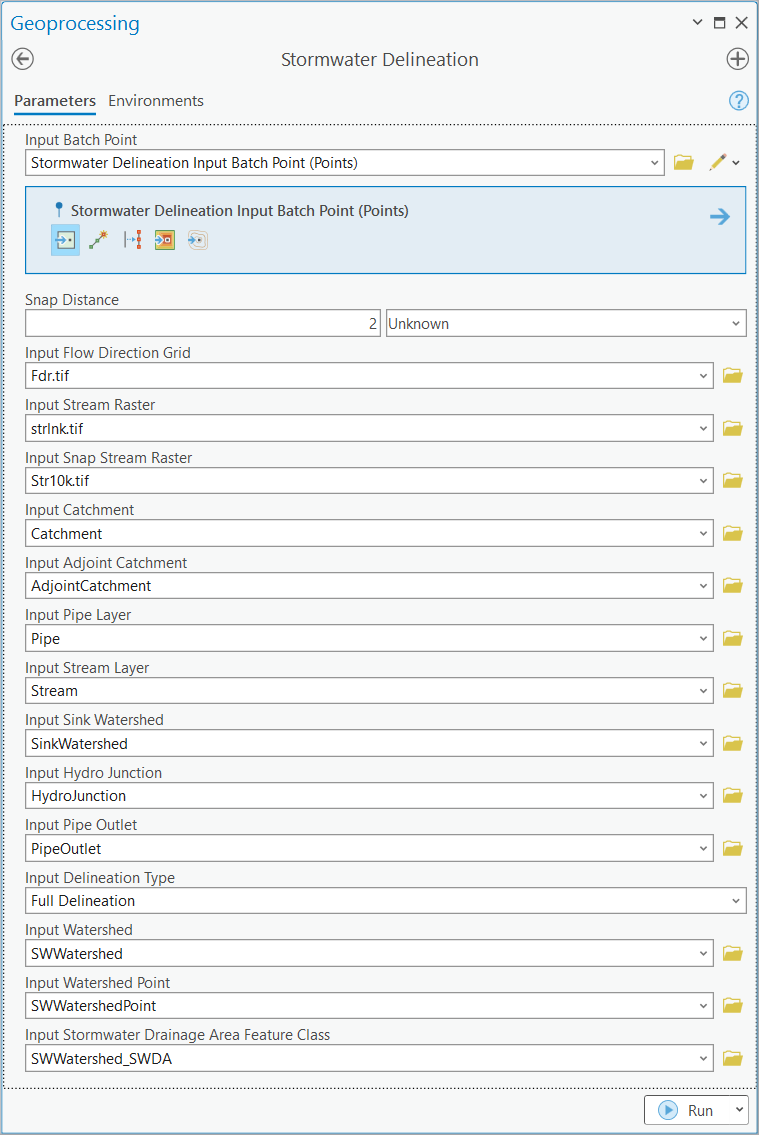
Check inputs and outputs. If you used standard naming conventions as presented in this document, default values will work, and you do not have to specify any of the input layers. If you created optional snap stream raster, set "Input Snap Stream Raster" to it. It is suggested that you select non-default output names (e.g., in the example above, "SW" was placed before default output names). Note that each time a tool is run, new feature classes are generated. If the output feature classes already exist, they will be overwritten.
- Make sure you select the right type of delineation ("Input Delineation Type").
Click on the point of interest in the map. Tool will place a point at the selected location. You can repeat this many times and generate several points before executing the tool. This can be used to run the tool as an interactive "batch" processor.
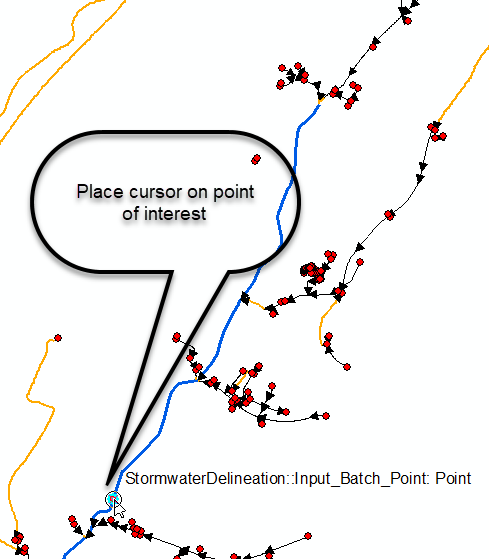
- Click on "OK" in the tool interface. The tool will run and delineate the watershed. During the run, tool will generate an extensive log (message) on what it is doing. Review it to get the familiarity with the activities and processing times during delineation process. Process scales well, so if you pass multiple points, each point will take roughly the same time to delineate.
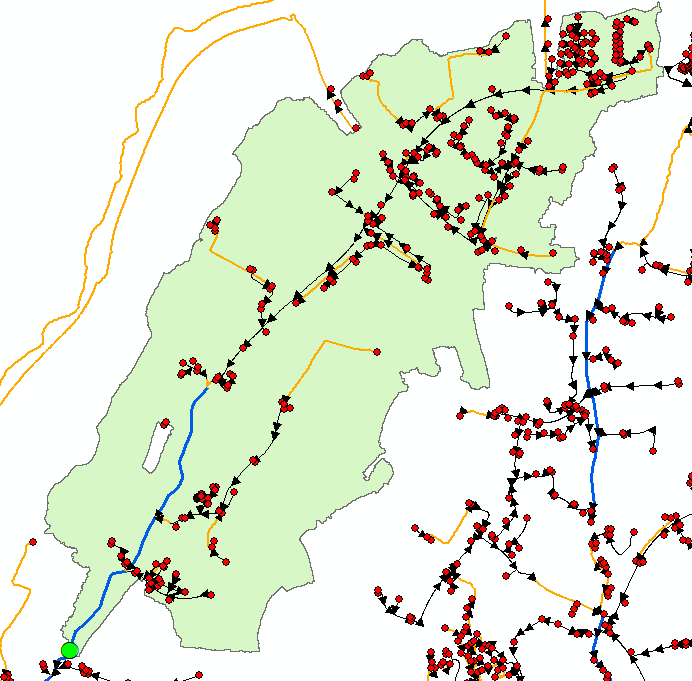
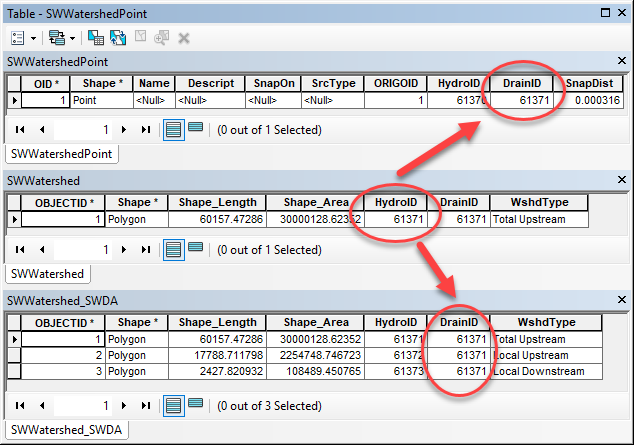
Green dot is the point of interest while the green-ish polygon is the total upstream contributing stormwater watershed. Tool generates three output layers:
Outlet point (WatershedPoint).
Watershed draining to the point (Watershed). This is the total area draining to the outlet point.
Stormwater drainage areas created in the process (Watershed_SWDA). This includes three types of areas:
Total drainage area draining into the point (identified by "Total Upstream" value in the WshdType field). This is the polygon that is also stored in the watershed feature class.
Local drainage area draining into the point (identified by "Local Upstream" value in the WshdType field). This is directly connected overland contribution to the point (does not include contribution through pipe system).
Local area (within the catchment) downstream from the point (identified by "Local Downstream" value in the WshdType field). This area might be of use in specialized applications.
The features in the three feature classes are tied together through HydroID->DrainID (where DrainID is the HydroID of the watershed that other features are related to) relationship. Note that the key drainage area is the total watershed (its HydroID is used to tie all the pieces together).
Downstream trace
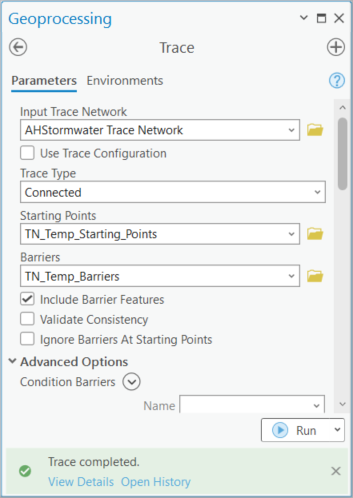
A custom tool is not developed for this functionality. Standard trace network tracing can be easily used to identify downstream path from a point of interest. Follow this procedure:
Click on the Trace Network tab.
Click to select type of the trace to perform ("Downstream" in this case, but other traces can be run as well).
Select Trace Locations>Starting Points and the click on the Map with Add features selected to place the starting location for the trace. A green circle will appear and the layer and if of the underlying network feature will be displayed.
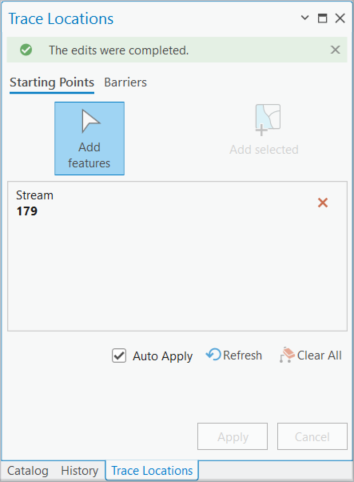
- Select the Trace Network if needed and click Run to execute the trace.
Create network connectivity
This tool establishes network element connectivity in tabular form that can be useful for specific custom applications that need simpler connectivity representation. This form is also easy to export to formats that can be used by different network solvers operating outside of ArcGIS environment.

Tool creates three outputs:
Nodes in the network (Node).
Connectors in the network (Link).
Drainage areas associated with the nodes in the network (CatchmentConn).
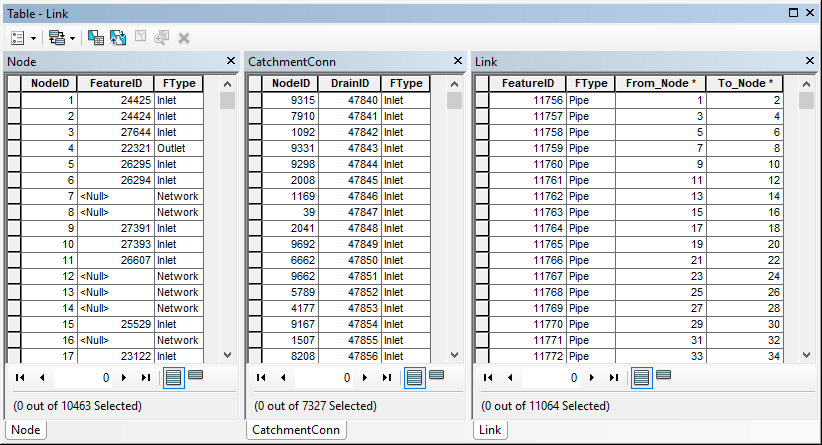
The following attributes are used to connect the three feature sets:
NodeID - unique identifier of a node.
FeatureID - pointer to the HydroID of the feature that generated that network element.
FType - type of the feature that generated that network element.
From_Node - NodeID of the from node of the link.
To_Node - NodeID of the to node of the link.
Tools and process automation
This section provides a list of tools used in the Arc Hydro stormwater data development and use workflow. Most of the tools used in the stormwater workflows have been part of Arc Hydro toolset for many years. The recent, stormwater specific tools are highlighted here.
Stormwater data development tools
Sample time of tool execution is provided for relative reference only (comparison of tool execution on a single dataset on a single computer). Actual time will vary depending on the complexity of the data (mostly DEM size) and the hardware used for processing. For reference, the sample dataset had:
DEM: 8,149 by 16,166 cells
Pipe: 8,721 features
StreamInit: 117 features
Stream: 1,333 features
HydroJunction: 5,515 features
PipeOutlet: 1,028 features
All of the tools used in the workflow are available in the Arc Hydro Tools Pro toolbox (highlighted in green are the stormwater specific tools). The following toolset abbreviation is used:
TP: Terrain Preprocessing
TP-DM: Terrain Preprocessing -> DEM Manipulation
| Step | Tool | Toolset | Sample time |
|---|---|---|---|
| 1 | Create Sink Structures | TP-DM | 1' 21" |
| 2 | Create Drainage Line Structures | TP-DM | 4' 15" |
| 3 | DEM Reconditioning | TP-DM | 4' 17" |
| 4 | Level DEM | TP-DM | 2' 23" |
| 5 | Fill Sinks | TP-DM | 1' 42" |
| 6 | Flow Direction | TP | 39" |
| 7 | Adjust Flow Direction in Sinks | TP | 53" |
| 8 | Adjust Flow Direction in Streams | TP | 28" |
| 9 | Create Overland Flow Connectors | TP | 4' 19" |
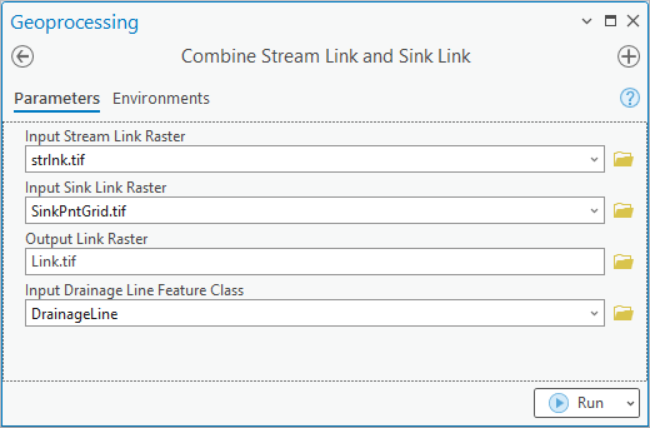
| 10 | Combine Stream Link and Sink Link | TP | 21" |
| 11 | Catchment Grid Delineation | TP | 2' 44" |
| 12 | Catchment Polygon Processing | TP | 14" |
| 13 | Adjoint Catchment Processing | TP | 44" |
| 14 | Sink Watershed Delineation | TP | 3' 32" |
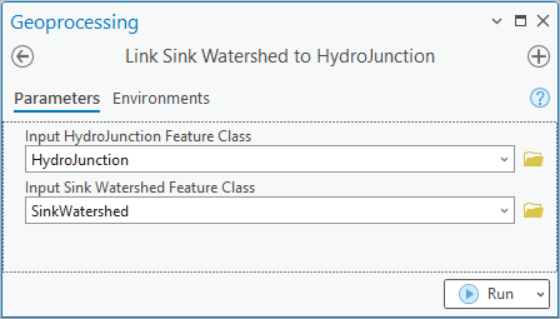
| 15 | Link Sink Watershed to HydroJunction | TP | 10" |
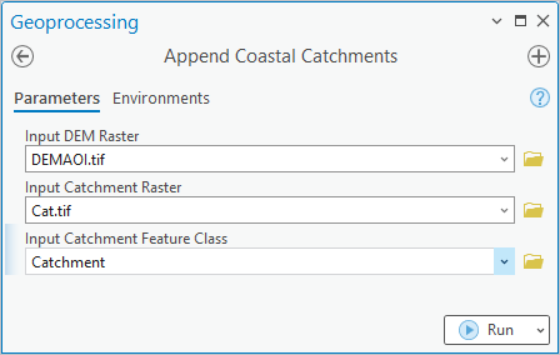
| 16 | Append Coastal Catchments | TP | 56" |
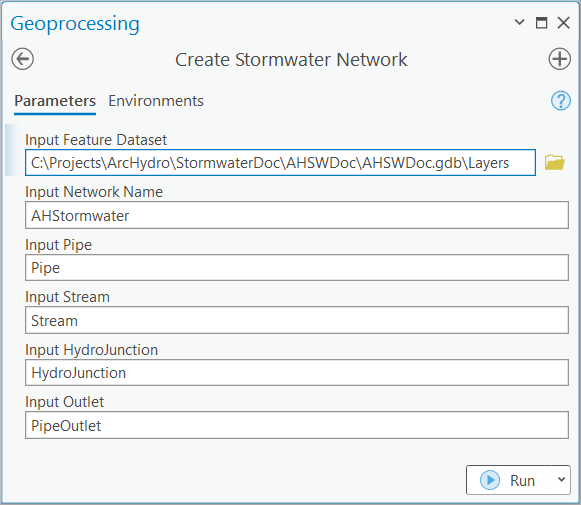
| 17 | Create Stormwater Network | TP | 14" |
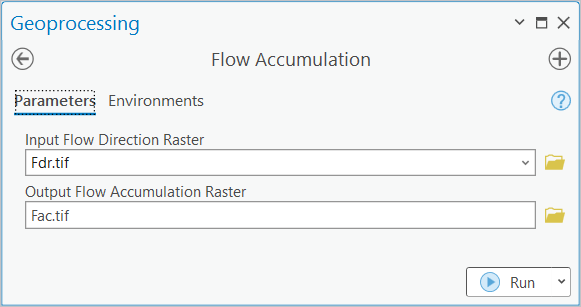
| 18 | Flow Accumulation | TP | 15' 49" |
| 19 | Stream Definition | TP | 17" |
The workflow is captured in tool "Stormwater Processing" (in Terrain Preprocessing Workflows -> Stormwater toolset) at the exception of the Create Stormwater Network tool that must be run independently due to locking issues. Output location (based on input data) and naming of all oputput layers is controlled by the tool and not accessible to the user.
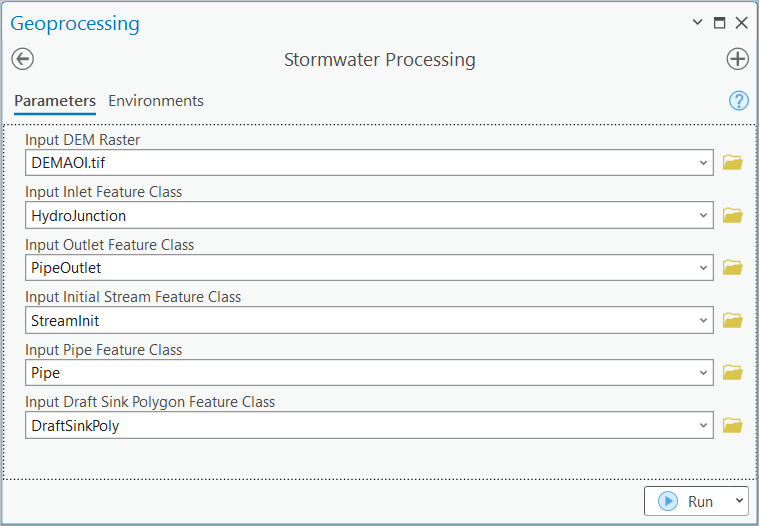
Results are presented in Appendix 1. Run took about 37 minutes.
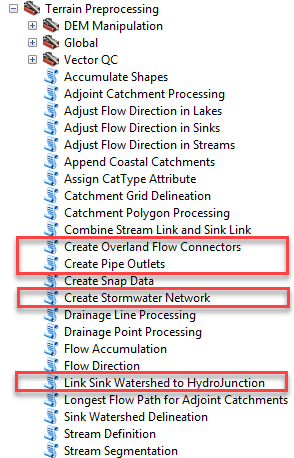
Location of the preprocessing tools is as follows:

Stormwater analysis tools
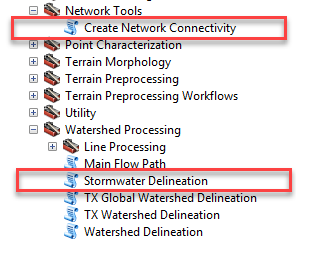
Location of the stormwater analysis tools is as follows:
Database design
This section provides database structures generated during the process. It follows the standard Arc Hydro data organization and naming conventions.


Raster data structures
| Layer name | Layer description | Output from Tool | Input to Tool | Used for |
|---|---|---|---|---|
| Agreedem | Reconditioned DEM with initial streams burnt in. | 3 | 4 | |
| Cat | Catchment raster associated to final streams. | 11 | 12 | |
| Demaoi | Input DEM. | 1,2 | ||
| Fac | Flow accumulation raster based on final flow direction | 18 | 19 | |
| Fdr | Final flow direction (adjusted for direction in streams and sinks) | 8 | 9,11,14,18 | Delineation |
| Fdrinit | Initial flow direction based on reconditioned, leveled and filled DEM (not extending into sink polygon). | 6 | 7 | |
| Fdrsinkadj | Initial flow direction adjusted to extend into sink polygon. | 7 | 8 | |
| Fdrstr | Flow direction under input streaminit to ensure water follows the stream features. | 2 | 8 | |
| Fil | Reconditioned and leveled DEM filled outside of the sinks | 5 | 6 | |
| Leveldem | Sink-leveled reconditioned filled DEM | 4 | 5 | |
| Link | Link raster created by combining final stream link and sink link and used to delineate catchments. | 10 | 11 | |
| Sinkpntgrd | Sink point raster. | 1 | 7,9,10,14 | |
| Sinkpolygrid | Sink polygon raster. | 1 | 7 | |
| Sinkwshgrid | Sink watershed raster. | 14 | ||
| Str10k | Cells draining at least 10k cells. Used for snapping. A different threshold may be used if more appropriate. | 19 | Delineation | |
| Strlnk | Stream link raster created after splitting initial streams and adding overland flow connectors | 9 | 10 | Delineation |
| Strlnkinit | Initial stream link raster created based on the initial streams. | 2 | 3,9 |
Vector data structures/network/relationship
| Layer name | Type | Layer description | Output from Tool | Input to Tool | Used for |
|---|---|---|---|---|---|
| AdjointCatchment | Poly | Adjoint catchments for final streams. | 13 | Delineation | |
| AHStormwater | Network | Arc Hydro Stormwater Trace Network. | 17 | ||
| Catchment | Poly | Catchments for streams. | 12 | 13,20 | Delineation, Connectivity |
| DraftSinkPoly | Poly | Input draft sink polygons | 1 | ||
| DrainageLine | Line | Final drainage lines after splitting streams and adding overland connectors. | 9 | 13 | Delineation |
| DrainageLineInit | Line | Drainage lines created based on initial streams. | 2 | ||
| EditPoint | Point | Stream vertex points used to enforce streams. | 2 | ||
| HydroJunction | Point | Input inlets to pipe or terrain. | 1,9,15,17 | Delineation | |
| HydroJunction_SinkWatershed | Rel | Relationship between HydroJunction HydroID and SinkWatershed JunctionID. | 15 | Delineation | |
| OverlandConnector | Line | Overland flow connector connecting PipeOutlet to stream, HydroJunction, PipeOutlet or other overland flow. | 9 | ||
| Pipe | Line | Input closed pipes layer. | 9,17 | Delineation, Connectivity | |
| PipeOutlet | Point | Input outlets from pipes to surface flow. | 9 | Delineation, Connectivity | |
| SinkPoint | Point | Raster-snapped sink point | 1 | ||
| SinkPolygon | Poly | Raster snapped sink polygon | 1 | 4,5 | |
| SinkWatershed | Poly | SinkWatershed associated to sinkpoint. | 14 | Delineation | |
| Stream | Line | Final stream segments containing split streams and overland flow connectors. | 2 | 17 | Delineation |
| StreamInit | Line | Draft stream segments. input | 2,9 |
Tabular data structures
| Layer name | Layer description | Output from Tool | Input to Tool | Used for |
|---|---|---|---|---|
| APUNIQUEID | HydroID dispenser | Delineation | ||
| Catchment_FS | Catchment flow split table storing flow split connectivity. | 13 | 4 | Delineation |
| DrainageLine_FS | Drainage line flow split table. | 2 | ||
| DrainageLineInit_FS | Initial drainage line flow split table. | 9 | 3 | |
| Pipe_FS | Pipe flow split table. | |||
| LAYERKEYTABLE | Not used. Related to HydroID dispenser. |