Flood Mapping with Height Above Nearest Drainage (HAND)
August, 2026
Download the PDF here
Introduction
This instructional document covers the sequential procedures for preprocessing flood extents at incremental heights derived from a high-resolution digital elevation model (DEM) using the Height above Nearest Drainage (HAND) methodology. The utility of these flood extents encompasses a diverse array of applications, ranging from flood forecasting to real-time rendering of flooding events and post-event damage assessment.
Use cases for these flood extents may encompass:
Flood Forecasting: By incorporating them into flow forecast models, flood extents serve as pivotal inputs for predicting flood events.
Real-Time Rendering of Flooding: Integration of flood extents with ground truth points obtained from field measurements facilitates the real-time depiction of flooding scenarios.
Damage Assessment Post Flooding Event: Utilization of high-water marks enables the determination of flood height in specific areas of interest, aiding in post-flooding damage assessment.
Flood Frequency Mapping: Use historical or simulated flow records to estimate the probability of flood extents, such as the 100-year and 500-year floodplains.
This document focuses on preprocessing flood extents for user-defined river stages within an area of interest. Chapter 6 illustrates how these floodplains support several of the use cases described above. Future documents may explore each use case in greater detail.
Document History
| Version | Description | Date |
|---|---|---|
| 1 | Initial document (EBA). | August 2026 |
. Document revision history.
Recommended Reading
Arc Hydro tools and workflows presented in this document build on and follow standard practices related to Arc Hydro project development. The following documents provide an overview of these practices and should be reviewed if you are new to Arc Hydro.
GeoWater Tutorial Series – in particular Tutorial 6, which the tools documented here accompany.
Terrain Preprocessing and HAND Concepts
Height Above Nearest Drainage (HAND) is a terrain normalization technique. For every cell in a digital elevation model (DEM), HAND stores the vertical difference between the elevation of that cell and the elevation of the stream cell into which it drains. The result is a raster in which cell values no longer represent elevation above a geodetic datum but height above the local channel bottom. Because the datum of the HAND raster is the stream itself, flood inundation can be approximated with a simple comparison: if water in a stream rises to a stage H (measured above the channel bottom), then every cell that drains to that stream and has a HAND value less than H is considered flooded, and its approximate depth of flooding is H minus HAND.
This simple relationship makes HAND an efficient foundation for flood mapping at scale. Instead of running hydraulic models across the landscape, flood extents and depths for any stage of interest can be derived directly from the HAND raster and its companion catchment raster. In the Arc Hydro implementation, the stream network is partitioned into short "model streams" (also called modeling streams), each with its own local catchment. Flooding is evaluated independently for each model stream within its own catchment, so different reaches can be flooded to different stages at the same time – exactly what is needed to map a spatially varying flood forecast.
Because HAND itself carries no discharge information, a companion rating curve is needed to translate a flow forecast (discharge, Q) into a stage (H). Arc Hydro derives a synthetic rating curve for every model stream during the flood data stack generation: at each depth increment ("flood slice"), the flooded cells within the catchment define channel hydraulic properties (wetted area, wetted perimeter, hydraulic radius, and top width), and discharge is computed from those properties using Manning’s equation with the segment roughness (ManningN) and slope (S0). The resulting table of stage-discharge pairs per stream allows any forecast discharge to be converted to a stage by interpolation, and from stage to a flood extent and depth using HAND.
The full set of precomputed products – flood extent polygons for every stream and every slice, per-slice hydraulic properties, and the rating curves – is called the flood data stack. It is computed once during preprocessing and then reused for any number of flood mapping requests, which is what enables near real-time rendering of forecast flooding.
The quality of the HAND surface, and therefore of every product derived from it, is controlled by the quality of hydro conditioning of the DEM. In high-resolution DEMs, road and railroad embankments act as artificial dams because the culverts and bridges that actually convey water are not often represented in the terrain surface. Arc Hydro conditions the terrain by identifying such artificial depressions (breach areas), cutting breach lines through the obstructions, and enforcing flat areas so that derived flow paths follow the real drainage pattern. The methodology assumes D8 flow modeling, steady and uniform flow within each reach, and no backwater effects; it is intended for fully dendritic areas.
Table 2 summarizes the key terms used throughout this document and identifies how each concept is realized in the Arc Hydro data model.
| Term | Description |
|---|---|
| DEM | Digital elevation model of the ground surface. Input to the workflow; may be raw or smoothed. The workflow does not perform smoothing or filling. |
| Hydro conditioning | Modification of the DEM so that modeled flow crosses embankments and flats the way water actually drains. |
| Breach area | Depression in the DEM upstream of an artificial obstruction (typically a road embankment) that traps modeled flow. |
| Breach line | Line along which the DEM is lowered so flow can pass through an obstruction (e.g., at a culvert). |
| Flat area | Extended low-relief area where flow directions derived from the DEM are ambiguous. |
| Flow direction (D8) | Raster encoding the direction of steepest descent for each cell. |
| Flow accumulation | Count of upstream cells draining through each cell. |
| Stream definition | Derivation of the draft stream network. In this workflow streams are initiated at the origination points of the forecast streams rather than by an accumulation threshold. |
| Forecast stream / catchment | Stream reaches and their drainage areas in the forecast model (National Water Model) for which discharge forecasts are published. |
| Model (modeling) stream | Stream segment used as the unit of HAND analysis; draft streams partitioned into approximately uniform lengths. |
| Catchment | Local drainage area of a single model stream segment. |
| Adjoint catchment | Aggregated area upstream of a catchment, used for fast watershed delineation. |
| Thalweg | Lowest-elevation path along the channel. The 3D stream line is smoothed so elevations decrease monotonically downstream. |
| HAND | Height Above Nearest Drainage; vertical drop from each cell to the stream cell it drains to. |
| HAND healing | Raising of the HAND surface along breach cuts so breached embankments do not appear flooded until overtopped. |
| Unit slope | Slope along the flow direction (drop per unit run), used as the energy slope in hydraulic computations. |
| Flood slice | Uniform stage increment at which flood depth and extent are precomputed. |
| Flood data stack | Complete set of precomputed per-slice flood extents and hydraulic properties for all model streams. |
| Synthetic rating curve | Stage-discharge (H-Q) relationship per model stream derived from HAND geometry and Manning’s equation. |
| Return period flow | Statistical discharge with a given annual exceedance probability (2-, 5-, 10-, 25-, 50-year). |
. Basic terrain processing and HAND vocabulary.
Workflow and Tool Overview
The terrain preprocessing workflow documented here is automated by a single Arc Hydro batch tool. It takes a raw high-resolution DEM and a forecast (NWM) stream and catchment layer, and produces a complete HAND-based flood data foundation designed for implementing the flood use cases described in this document with additional Arc Hydro tools.
Dendritic Batch Process (Arc Hydro Tools Pro > Terrain Preprocessing Workflows > HAND). Performs the full terrain processing sequence: hydro conditioning, flow direction and accumulation, stream and catchment definition, HAND generation, and flood data stack / rating curve creation. It is intended for small, fully dendritic areas (streams draining up to about 10 square miles) and is a companion to the GeoWater book tutorial series (Tutorial 6).
The general terrain processing steps automated by the Dendritic Batch Process are:
Identify, select, adjust, and consolidate breach areas, and burn breach lines into the DEM.
Identify and select flat areas and burn them into the DEM.
Compute flow direction and flow accumulation using continuous flow (CF).
Define draft streams from the origination points of the input forecast streams and partition them into model streams.
Create a 3D representation of the model streams and enforce it into the DEM.
Create model catchments and adjoint catchments.
Relate model streams to the forecast streams and areas (forecast ID conflation).
Create HAND and related surfaces.
Perform flood data stack and rating curve generation.
Required Inputs
The Dendritic Batch Process requires a projected input DEM (raw or smoothed – the tool performs no smoothing or filling), a forecast stream layer, and a forecast catchment layer with a field holding the forecast unique identifier (the NWM COMID in the tutorial data). Although the stream input is called the "forecast stream layer," any stream layer can be used – its origination points control the drainage density of the derived draft streams. Because many of the floodplain use cases mentioned in this document rely on forecasted or return-period flows from the NWM, the NWM streamlines (NHD Plus High Resolution Dataset streamline) are used in many of the examples. The model stream network only needs to match the density of the forecast streams; more detailed streams would not have corresponding NWM datasets to reference. Two optional inputs refine hydro conditioning: a draft culvert line layer with known breach locations, and a road layer (with a search distance) used to limit automated breaching to depressions near roads.
Horizontal and vertical units of all inputs must be consistent (all meters or all feet). Stage values produced by the workflow are in DEM vertical units and are measured above the channel bottom (thalweg), the same datum as the HAND raster. The flow frequency mapping tool converts NWM discharges (delivered in cubic feet per second) into map units based on the horizontal spatial reference of the stream layer.
Data Organization and Naming Conventions
All output names are hard-coded following standard Arc Hydro layer naming conventions to facilitate process automation. Outputs are placed relative to the inputs: vector outputs are written to the geodatabase (and feature dataset) containing the input forecast stream layer; raster outputs are written to the folder containing the input DEM and inherit the DEM’s raster format (e.g., .tif); and the flood data stack is written to a FloodDataStack folder created next to the project geodatabase, containing the FP.gdb flood data stack geodatabase. Chapter 5 describes the resulting database design in detail, and Appendix 1 provides the full data dictionary.
Dendritic Batch Process
This chapter documents each processing step performed by the Dendritic Batch Process tool, in the order the steps are executed. Subsection numbering matches the processing messages reported by the tool at run time.
The tool automates dendritic terrain processing from a raw DEM through the complete flood data stack. Draft streams are initiated from the origination points of the forecast streams, so the derived network has a similar line density to the forecast network. Table 3 lists the tool parameters.
It is also worth mentioning that if greater flexibility of the processing is required, or hardcoded parameters within the tool need to be changed, it is possible to run all of the steps outlined in this chapter’s subsections, as they are simply other Arc Hydro or Spatial Analyst tools being changed together in one geoprocessing tool.
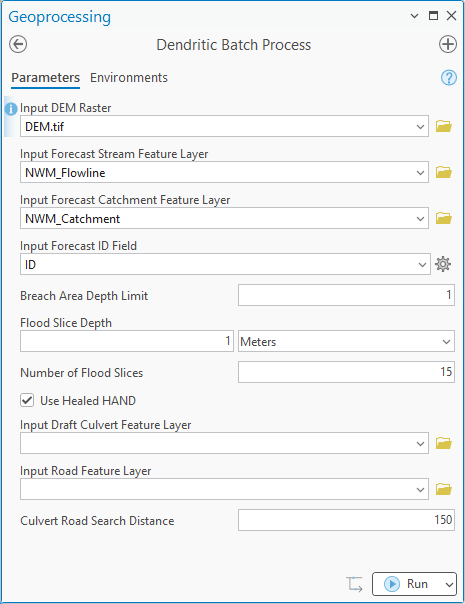
. Dendritic Batch Process tool user interface.
| Parameter | Description | Type |
|---|---|---|
| Input DEM | Input elevation raster (raw or smoothed; the tool will not smooth or fill). | Raster Layer |
| Input Forecast Stream Layer | Stream layer whose origination (most upstream) points define where draft streams are initiated. | Feature Layer |
| Input Forecast Catchment Feature Layer | Forecast catchment layer (one polygon per flow forecast reach), used to conflate the forecast ID onto the model streams. | Feature Layer |
| Input Forecast ID Field | Field in the forecast catchment layer containing the forecast unique identifier (e.g., ID / COMID). | Field |
| Breach Area Depth Limit | Depth threshold in map units. Depressions whose maximum depth (RANGE attribute) is below this value are not breached. Default 1. | Double |
| Flood Slice Depth | Uniform stage increment used in flood slicing (a linear unit, converted internally to DEM units). | Linear Unit |
| Number of Flood Slices | Number of slices; the stack is built for stages 0 through N x slice depth. | Long |
| Use Healed HAND | If checked, the HAND surface is healed along breach lines so flood polygons do not indicate flooding inside the breach cuts until the stream stage overtops the surrounding terrain. | Boolean |
| Input Draft Culvert Layer (optional) | Known culvert / breach lines. Combined with automatically generated breach lines before burning. Breach areas already served by a draft culvert are removed from automated breaching. | Feature Layer |
| Input Road Layer (optional) | If provided, only breach areas within the search distance of a road are considered for automated breaching. | Feature Layer |
| Culvert Road Search Distance (optional) | Distance used to select breach areas near roads. | Double |
| Output Folder (derived) | Folder containing the FloodDataStack outputs; derived by the tool. | String |
. Dendritic Batch Process parameters.
In addition to the exposed parameters, a number of processing settings are fixed inside the tool (Table 4). These values reflect Arc Hydro recommended practice for dendritic areas and standardize the outputs across projects.
| Setting | Value | Applies To Tool |
|---|---|---|
| Breach area area / volume limits | 0 / 0 | Identify Breach Areas (all depressions pass; only the depth limit filters). |
| Breach line length limit | 150 map units | Create Breach Lines. |
| Endpoint adjustment search distance / orientation / Z threshold | 10 / Whole line / 0 | Adjust Lines End Points (input culverts). |
| Burn statistic | Interpolate | Burn Lines Into DEM. |
| Flat identification angle threshold / search distance / skip distance | 1 degree / 10 / 0 | Identify Flat Areas. |
| Landform classes treated as flat | Flat; Footslope; Pit | Identify Flat Areas. |
| Flat area threshold | 2000 | Identify Flat Areas (minimum flat size retained). |
| Snap pour point distance | 50 map units | Snapping forecast origination points to flow accumulation. |
| Model stream split distance | 1500 map units, equidistant | Splitting draft streams into model streams. |
| 3D line smoothing | Smoothing without interpolation; system smoothing; same Z values on junctions | Smooth 3D Lines. |
| 3D line rasterization cell assignment | MINIMUM | Convert 3D Line To Raster. |
| HAND healing threshold (Delta) | 0.5 x Breach Area Depth Limit | Healed HAND generation. |
| Flood stack restrictions | River-connected areas only; vector masking per catchment | Create Flood Data Stack From HAND. |
| Flood stack depth rasters | Not saved (recomputed on demand) | Create Flood Data Stack From HAND. |
. Fixed processing settings applied by the Dendritic Batch Process.
Workspace and Environment Setup
The tool first derives all workspaces from the inputs. The geodatabase and feature dataset are read from the location of the input forecast stream layer; the raster workspace is the folder containing the input DEM, and the DEM’s file extension is captured so all raster outputs are created in the same format. A FloodDataStack folder is created in the same folder as the project geodatabase if it does not already exist. The flood slice depth is converted from its stated unit into DEM linear units, and the list of stages to process is generated as 0, d, 2d, … Nd, where d is the slice depth and N is the number of slices. Finally, the current parallel processing factor environment setting is honored if set; otherwise, each internal tool selects its own parallelization.
Hydro Conditioning – Breach Enforcement
This step locates artificial depressions in the DEM and cuts breach lines through the obstructions that cause them, producing a line-conditioned DEM. Sub-steps:
4.2.1 Identify breach areas. The Arc Hydro Identify Breach Areas operation evaluates DEM depressions against the Breach Area Depth Limit (area and volume limits are set to 0, so depth alone controls selection). Outputs are the breacharea raster, the BreachArea polygon feature class with depression statistics (AREA, MIN, MAX, RANGE, MEAN, SUM, VOLUME, Compactness), and the BreachPoint feature class marking each depression’s deepest point (POINT_X, POINT_Y, ELEVATION).
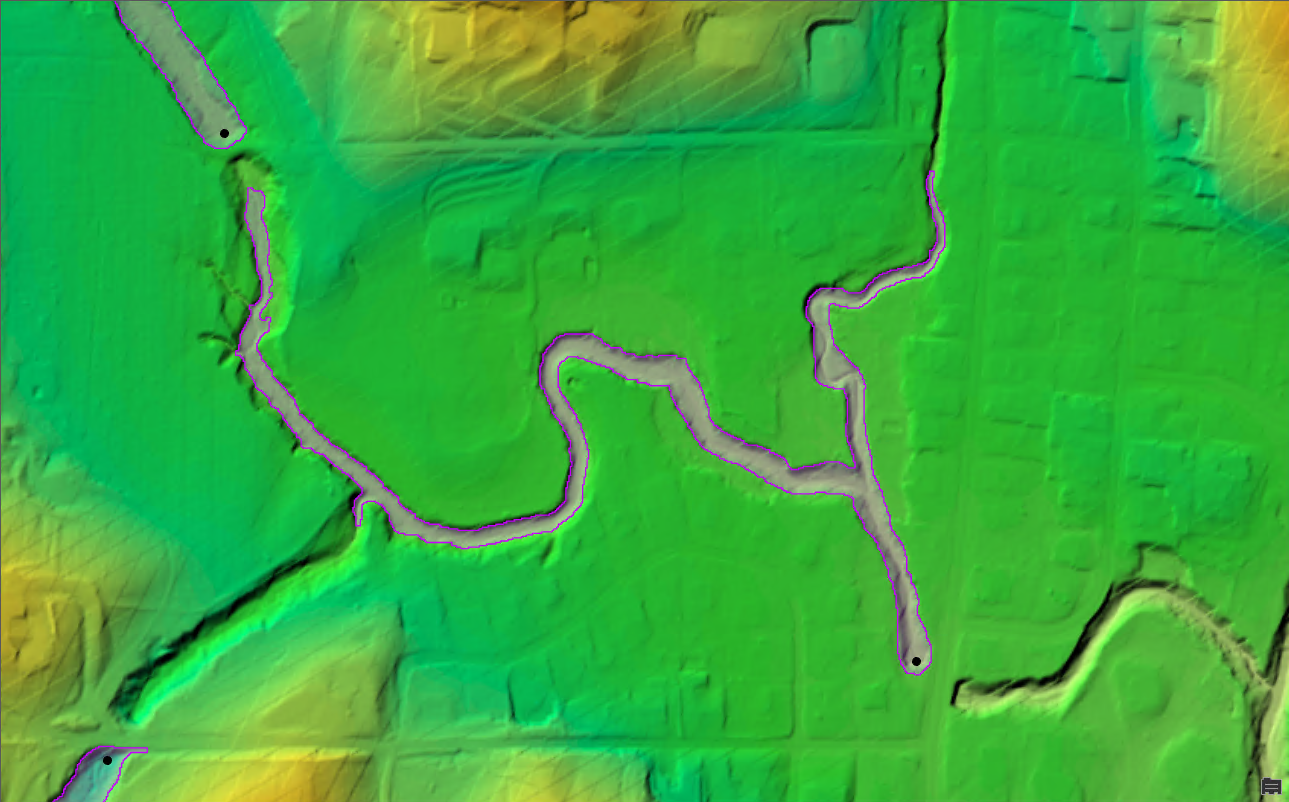
. Sample terrain with breach areas identified.
4.2.2 Select breach areas. If a road layer is provided, only BreachArea polygons within the Culvert Road Search Distance of a road are carried forward into BreachAreaBreach; otherwise all breach areas are used. If a draft culvert layer is provided, breach areas intersecting a draft culvert are then removed from BreachAreaBreach – those locations will be breached by the provided culvert lines instead. Breach points falling within the final polygons are saved to BreachPointBreach.
4.2.3 Create breach lines. The Create Breach Lines operation generates a breach line from each selected breach point through the obstruction to the downstream side, subject to the 150 map unit length limit, producing the BreachLine feature class (3D-aware, with FROM_VAL / TO_VAL endpoint elevations).
4.2.4 Adjust input breach lines. If a draft culvert layer is provided, Adjust Lines End Points drops each culvert line’s endpoints to the lowest surrounding DEM values (search distance 10, whole line orientation, Z threshold 0) so the line will drain when burned, producing InCulvert_Adj.
4.2.5 Consolidate breach lines. Adjusted culvert lines are appended to BreachLine so automated and known breaches are enforced together.
4.2.6 Burn breach lines into the DEM. Burn Lines Into DEM lowers the DEM along the consolidated breach lines using the Interpolate statistic, producing the dem_burn raster.
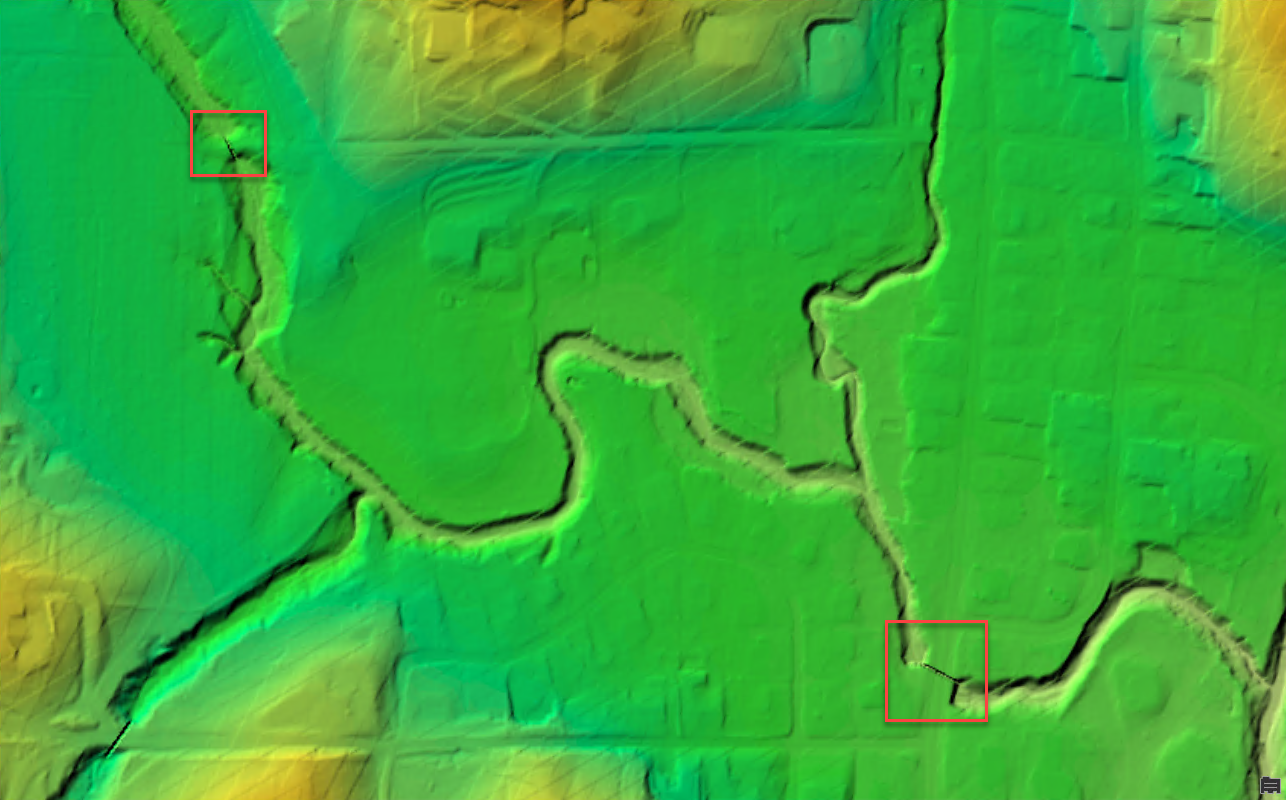
. Locations where breach lines were burned into the DEM.
Hydro Conditioning – Flat Area Enforcement
4.3.1 Identify flat areas. The Identify Flat Areas operation classifies landforms on the line-burned DEM (angle threshold 1 degree, search distance 10) and extracts areas classified as Flat, Footslope, or Pit that exceed the 2000-cell area threshold. Outputs are the landform and flat rasters and the AHFlatPoly polygon feature class.
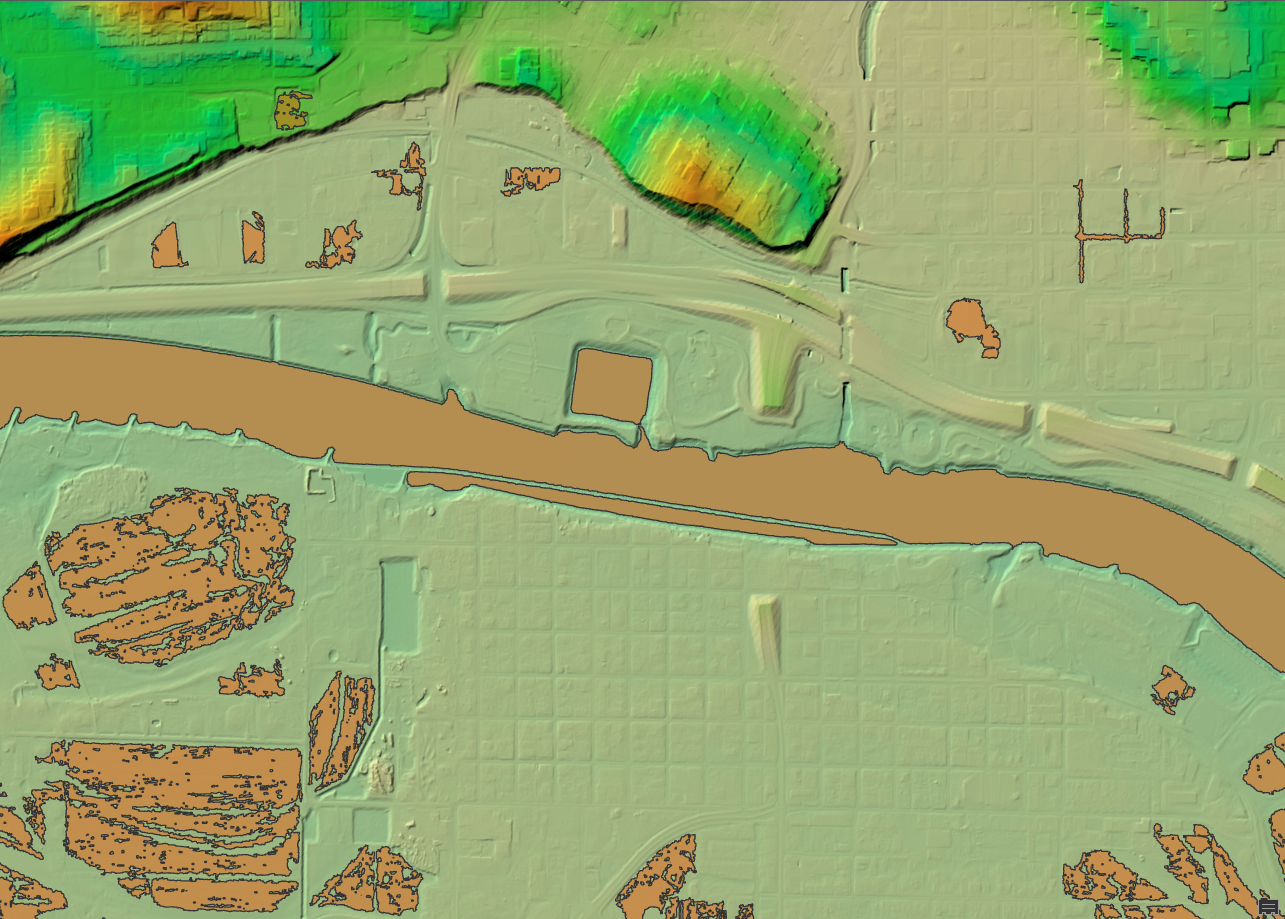
. DEM locations where flat areas are identified.
4.3.2 Select flat areas. Only flat polygons that intersect the input forecast streams are enforced (these are the flats the derived streams must cross). Selected polygons are saved to AHFlatPolyBurn and rasterized to the flatflat raster, snapped and cell-matched to the DEM.
4.3.3 Burn flat areas. Burn Flat Polygons Into DEM enforces a drainage gradient across the selected flats, producing the demflatburn raster (with the flatburn raster as a by-product). If no qualifying flat areas are found, this step is skipped and dem_burn is used in further processing.
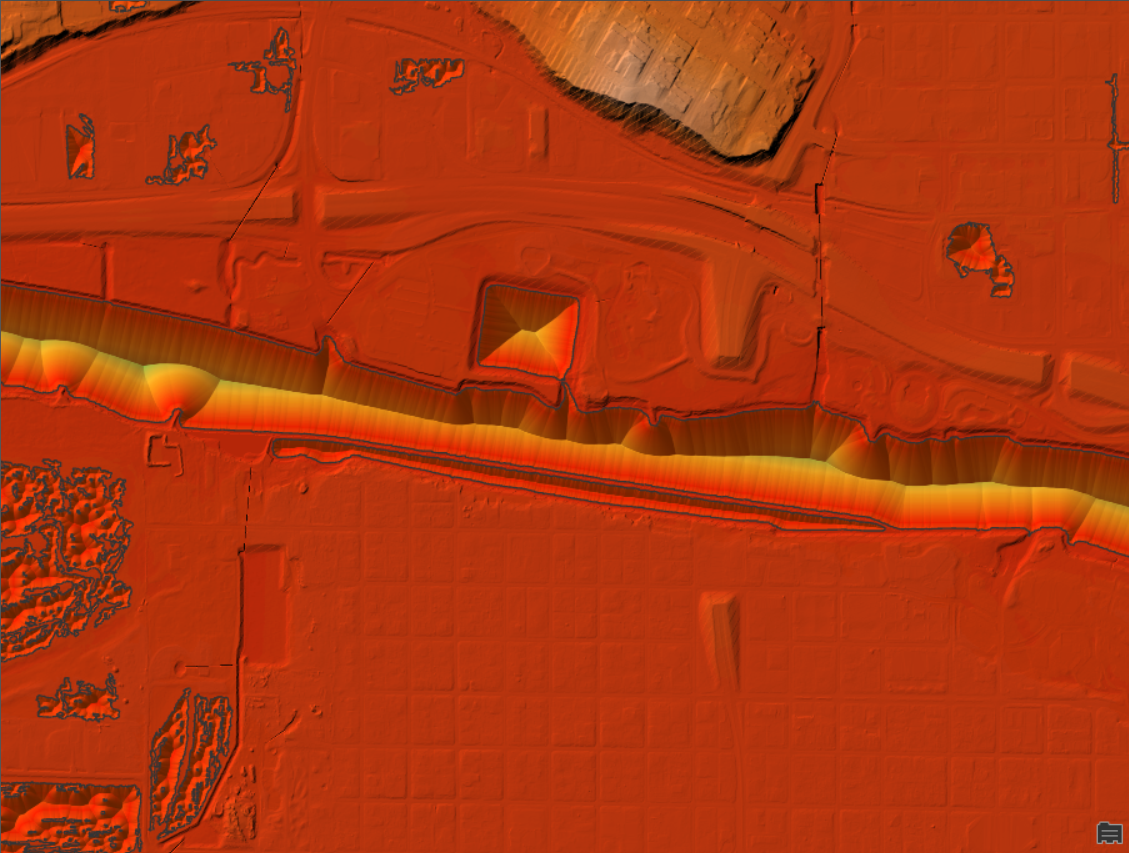
. Result of flat area burning.
Terrain Preprocessing – Flow Direction and Accumulation
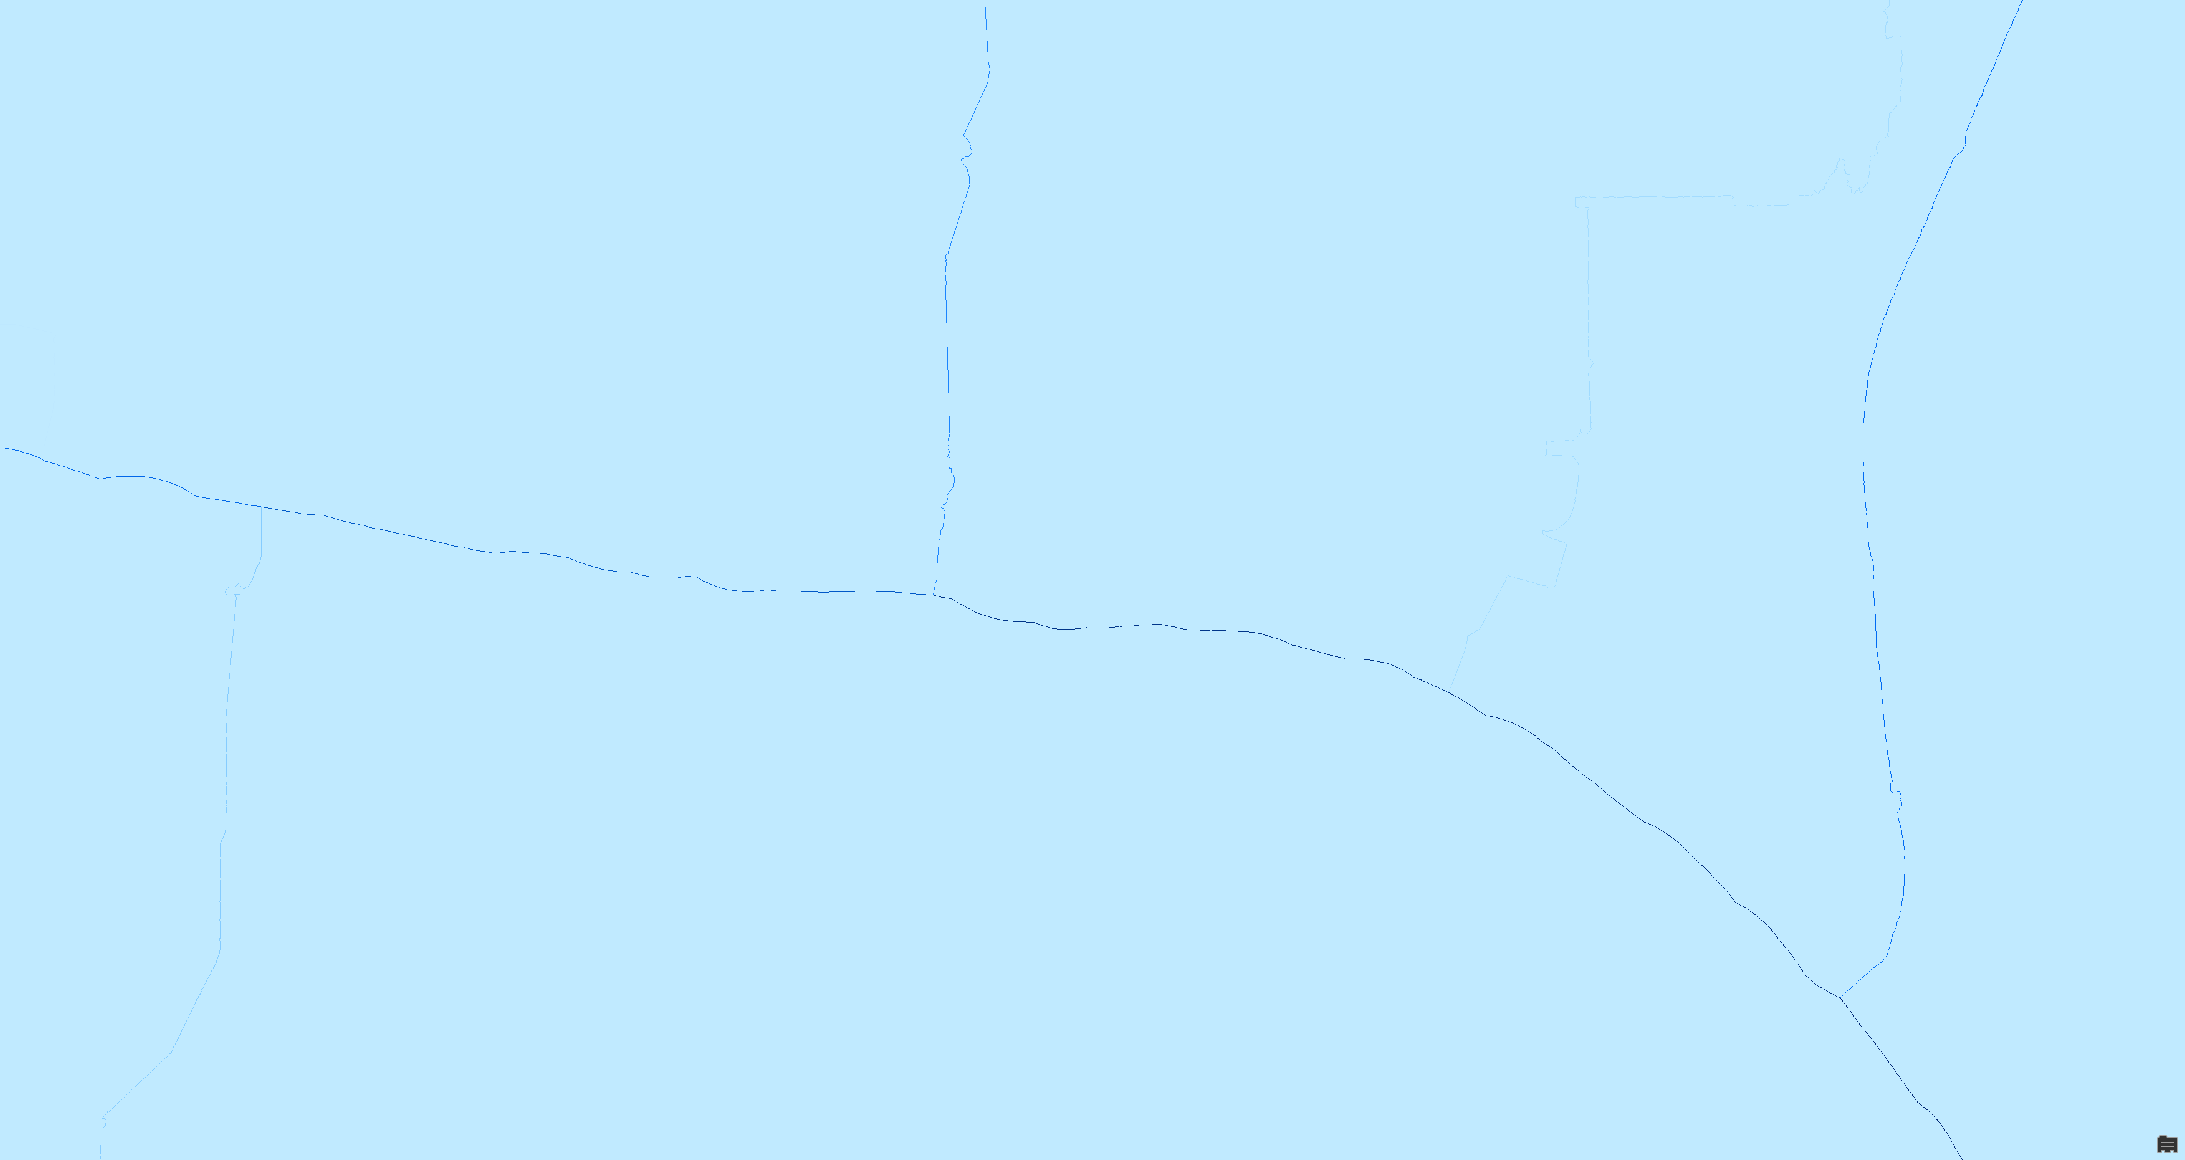
Flow Direction and Accumulation Using CF derives the D8 flow direction (fdr) and flow accumulation (fac) rasters from the conditioned DEM in a single continuous-flow pass with automatic depression handling. No sink polygons are used in this dendritic configuration – the conditioned terrain is treated as fully draining.
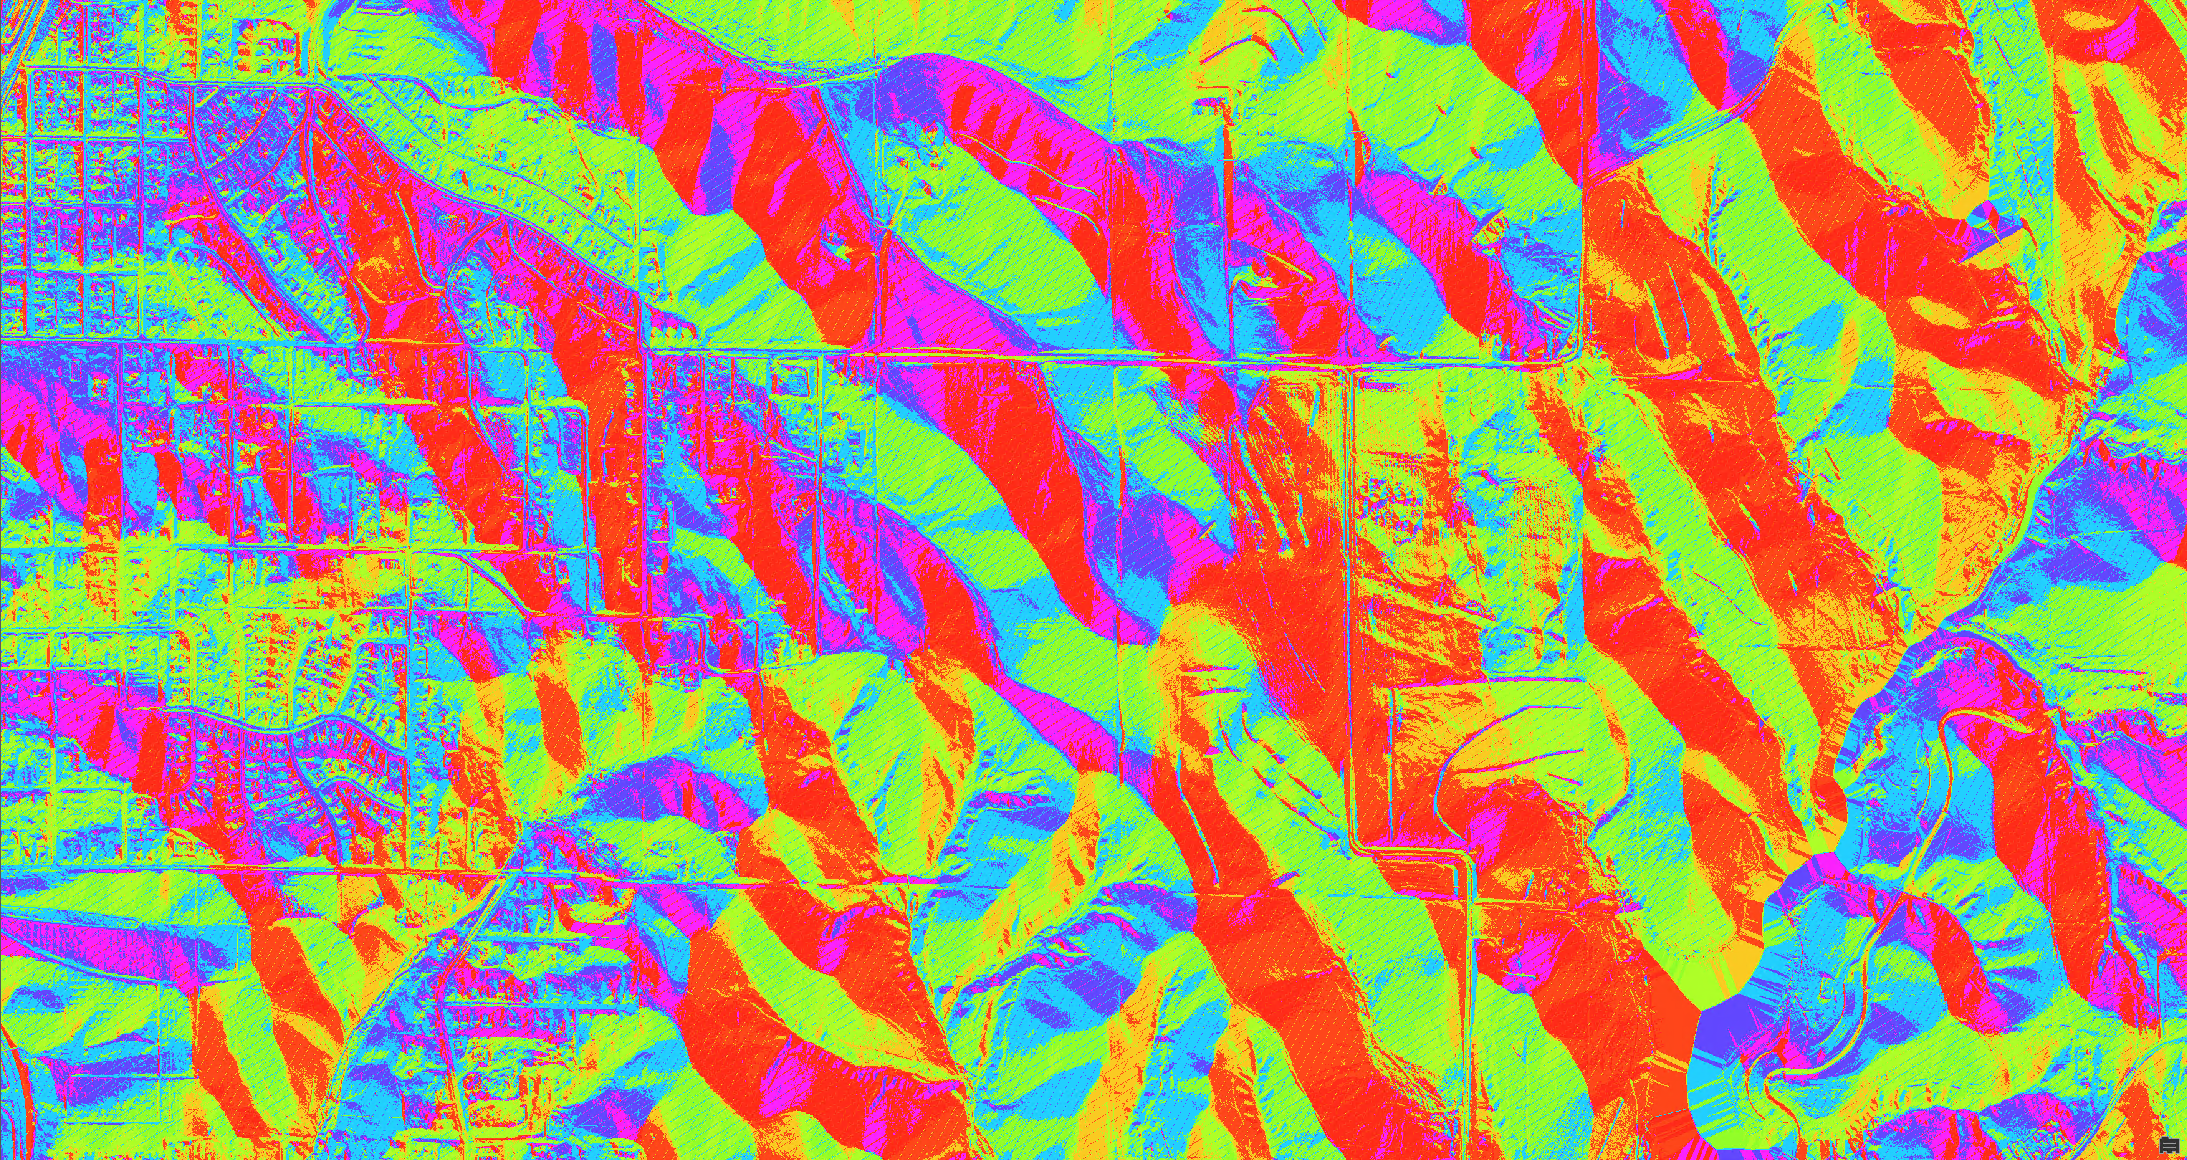
. Output flow direction raster.
. Output flow accumulation raster.
Terrain Preprocessing – Stream Definition
4.5.1 Identify drainage lines. The origination (start) points of the forecast streams are extracted to ForecastOriginationPoint and snapped to the cell of highest flow accumulation within 50 map units (originraster). Flow direction values of 255 (undefined) are replaced with 0 in a copy of the flow direction raster (fdr_adj), and Optimal Path As Raster traces the path from each origination point down the accumulation surface (origincostpath). The traced paths become the stream raster (str), are segmented at confluences with Stream Link (strlnk), and are vectorized with Stream To Feature into the StreamLine feature class. StreamLine is then attributed with the standard Arc Hydro identity and network fields: Assign HydroID, Generate From/To Node for Lines, Find Next Downstream Line (NextDownID, with any flow splits recorded in StreamLine_FS), and Assign River Order (PU_Order).
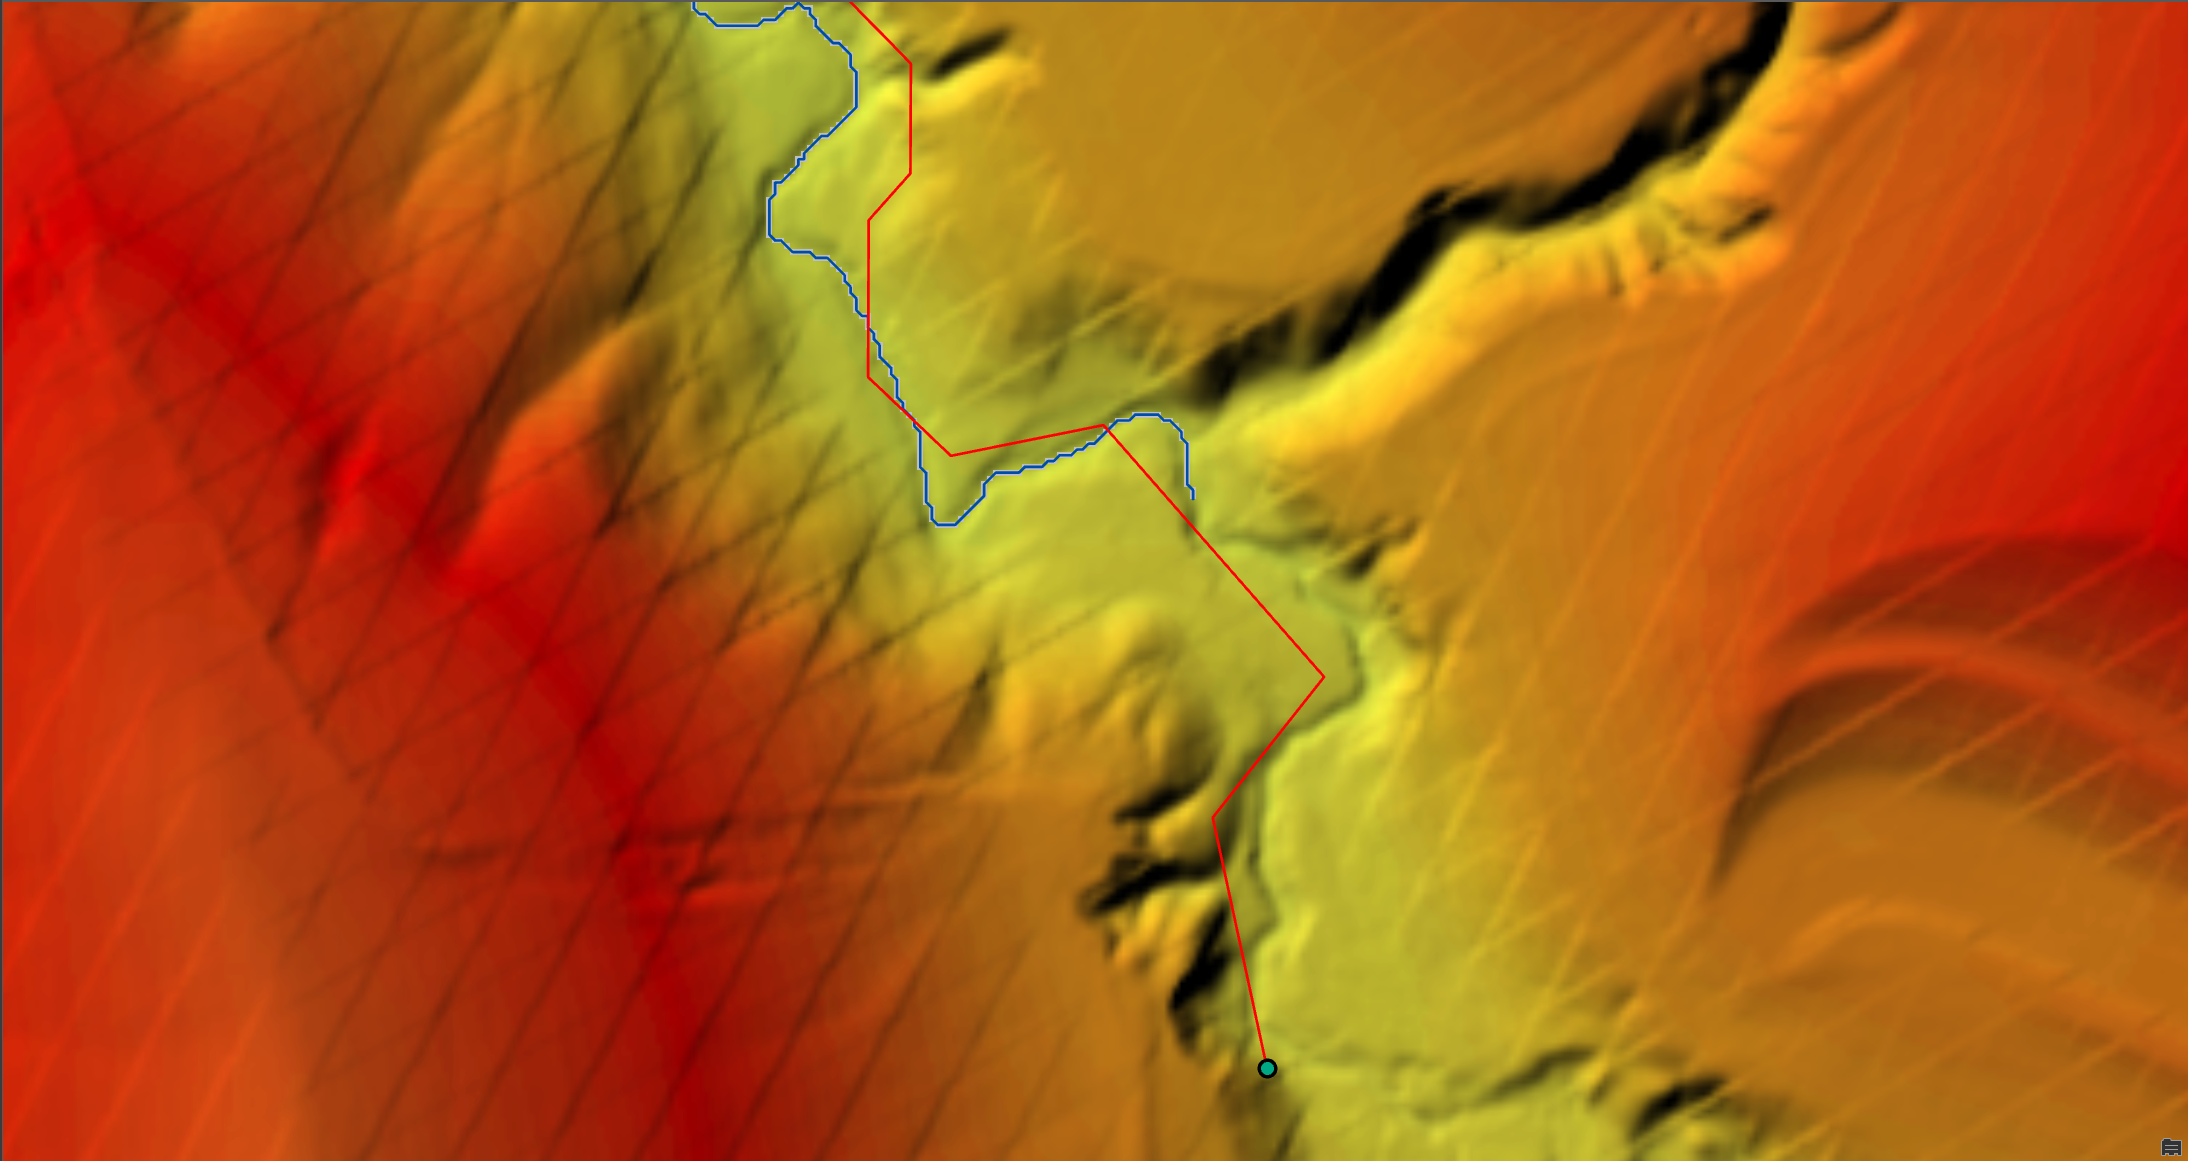
. Red line representing the forecast stream, green dot marking the stream origination point, and blue line representing the start of the model stream at the cell of highest flow accumulation within 50 map units of the origination point.
4.5.2 Construct 3D line. Construct 3D Line drapes StreamLine over the line-burned DEM (dem_burn) to create StreamLine3D, and NextDownID is recomputed for the 3D features (StreamLine3D_FS). Mainstem QC fields carried over by the processing are dropped.
4.5.3 Smooth 3D lines. Smooth 3D Lines produces StreamLine3D_Smooth using smoothing without interpolation and system smoothing, forcing identical Z values at junctions. The result is a monotonically descending thalweg profile for every stream.
4.5.4 Convert 3D line to raster. The smoothed 3D lines are rasterized to str3d using the MINIMUM cell assignment, so each stream cell carries the lowest local thalweg elevation.
4.5.5 Burn the thalweg into the DEM. The input DEM is copied to demthaladj and the str3d raster is mosaicked into it (last value wins), enforcing the smoothed channel bottom into the terrain. This thalweg-adjusted DEM is the elevation reference for HAND.
Terrain Preprocessing – Model Streams and Catchments
4.6.1 Split stream lines and create model streams. Each draft stream is partitioned into approximately equal segments no longer than 1500 map units: a per-feature split distance is computed (LineSplitDistance = length / (int(length / 1500) + 1)), split points are generated at that interval (DrainageLinePointSplit), and the lines are split at those points into DrainageLineSplit – the model stream feature class. The segments are re-attributed (HydroID, from/to nodes, NextDownID with DrainageLineSplit_FS, PU_Order), GridID is set equal to HydroID, and Conflate Forecast ID To Model Stream transfers the forecast identifier from the forecast catchments onto each model stream (written to a field named after the input Forecast ID field; ID in the tutorial data). Finally the model streams are rasterized by HydroID (with PU_Order as the priority field) into the strlnk2 stream link raster, snapped and cell-matched to the DEM.
4.6.2 Define model catchments. Catchment Grid Delineation assigns every cell to the model stream segment it drains to (cat raster, VALUE = GridID); Catchment Polygon Processing converts the grid to the Catchment feature class (GridID, HydroID, NextDownID); and Adjoint Catchment Processing builds the aggregated upstream areas (AdjointCatchment, with Catchment_FS recording catchment connectivity splits).
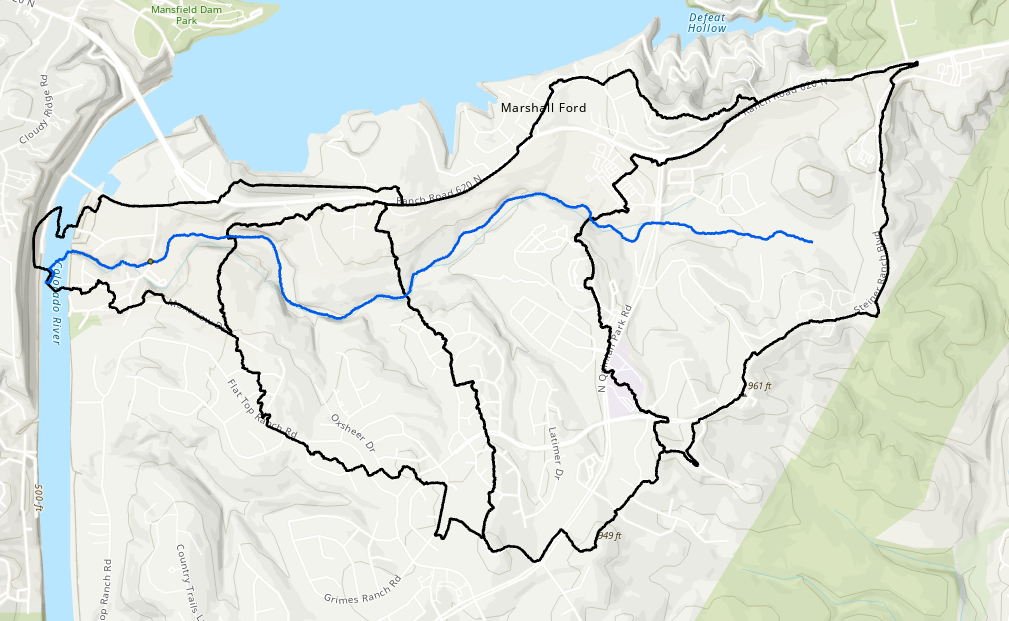
. Catchment defined for each model stream reach.
Creating HAND and Derived Surfaces
4.7.1 HAND. Flow Distance computes, for every cell, the vertical drop along the D8 flow path (minimum across paths) from the cell to the strlnk2 stream cells, over the thalweg-adjusted DEM. The result is the hand raster: height above nearest drainage, with the channel bottom as the zero datum. Negative and near-zero values produced by rounding are cleaned by setting all values at or below 0.01 to 0, giving the handgt0 raster.
4.7.2 Healed HAND. If Use Healed HAND is checked, the tool computes the difference between the original DEM and the thalweg-adjusted DEM – positive wherever conditioning cut through embankments or lowered the channel – and adds that difference back to HAND wherever it is at least Delta = 0.5 x Breach Area Depth Limit, producing the handhealed raster. The effect is that flood slices will not indicate flooding within a breach cut until the stream stage actually overtops the surrounding terrain, which produces more realistic flood extents around roads while retaining the breach for flow modeling.
4.7.3 Unit slope. Make Unit Run Slope derives the unitrun raster from the thalweg-adjusted DEM: the drop per unit run along the flow direction. It supplies the energy slope used in the flood stack hydraulic computations.
Creating the Flood Data Stack and Rating Curves
Create Flood Data Stack From HAND (Pro) is executed with the model streams (DrainageLineSplit), catchments (Catchment), the selected HAND raster (handhealed if healing is enabled, otherwise handgt0), the stream link raster (strlnk2), the unit slope raster, and the list of stages defined in Section 4.1. Flooding is restricted to river-connected areas, masking is performed per catchment using vector masks, and per-slice depth rasters are not saved (they can be recreated on demand from HAND and the stack tables).
For each stage in the list, the tool intersects the HAND surface with the stage within each model stream’s catchment, derives the flooded extent, and computes the hydraulic properties of the flooded channel (wetted area A, wetted perimeter P, hydraulic radius R, and top width B, with segment length Length_m). Discharge Q for the slice is computed from those properties with Manning’s equation using the per-segment slope (S0) and a default roughness value (ManningN value of 0.045), both stored on the stack copy of the model streams. All results are written to the FP.gdb geodatabase in the FloodDataStack folder:
FPRiver and FPCatchment – stack copies of the model streams and catchments (FPRiver carries ManningN and S0).
HTable – registry of processed slices (HIndex, HValue, ISDONE), which also makes the process restartable.
FPZone and FPZoneRiver – flood extent polygons per slice, merged (FPZone) and per model stream (FPZoneRiver, keyed by StreamID, HIndex, HValue, and CompositeID).
pf_ModelStream – the synthetic rating curve table: one row per model stream per slice with StreamID, GridID, Length_m, H, B, R, A, P, HIndex, Q, and RiverID.
LogTable – the parameters used for the run (ParamName, ParamDesc).
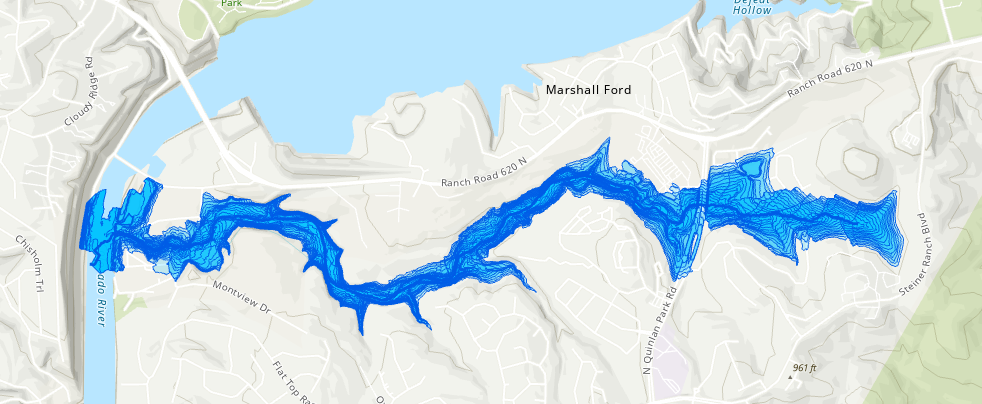
. FPZoneRiver feature class showing flood slices from HIndex 1 to 15.
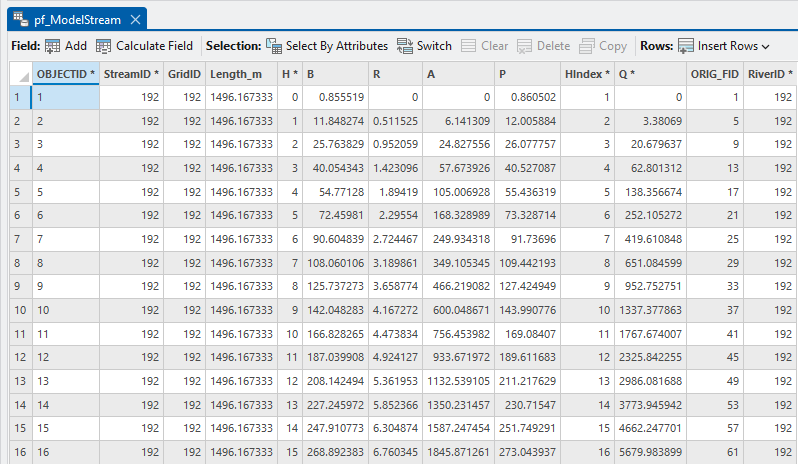
. pf_ModelStream output table.
A final cleanup step releases temporary datasets and restores the geoprocessing environment; the tool returns the output folder as its derived output. The complete result of the Dendritic Batch Process is a comprehensive Arc Hydro raster and vector data foundation that supports both watershed and floodplain analyses.
Database Design of the Workflow Outputs
The workflow deliberately separates its outputs into a small number of containers with hard-coded names so that downstream tools – and any automation built on top – can rely on the structure. This chapter describes each container and the identifier scheme that ties vector, raster, and tabular outputs together. Appendix 1 contains the complete element and field inventories.
Storage Containers
| Container | Contents | Populated By |
|---|---|---|
| Project geodatabase (\<Project Name>.gdb), Layers feature dataset | Input layers (forecast streams / catchments, optional culverts, roads, AOI) and all derived vector layers (breach, flat, stream, and catchment feature classes). | User inputs; Dendritic Batch Process. |
| Project geodatabase root | Arc Hydro tables: APUNIQUEID and the *_FS flow split tables. | Dendritic Batch Process. |
| Layers folder | All raster outputs, named with fixed names plus the DEM extension. | Dendritic Batch Process. |
| FloodDataStack folder, FP.gdb | Flood data stack: FPRiver, FPCatchment, FPZone, FPZoneRiver, HTable, pf_ModelStream, LogTable; return period outputs when Map NWM Retrospect FF Qs is run against FPRiver. | Create Flood Data Stack From HAND; Map NWM Retrospect FF Qs. |
| \<Streams>_depth folder | Return period flood depth rasters (rf_*_h). | Map NWM Retrospect FF Qs. |
| Scratch workspace | Transient processing datasets (e.g., hidtoh_table, per-slice zone conversions). Not part of the deliverable. | Both tools. |
. Storage containers created and populated by the workflow.
Terrain Preprocessing Project Geodatabase
The project geodatabase follows the standard Arc Hydro project layout: feature classes live in the Layers feature dataset (one spatial reference for all layers) and supporting tables live at the geodatabase root. Three groups of feature classes coexist. Input layers (NWM_Flowline, and NWM_Catchment) are provided by the user. Hydro conditioning layers (BreachArea, BreachPoint, BreachAreaBreach, BreachPointBreach, BreachLine, InCulvert_Adj, AHFlatPoly, AHFlatPolyBurn, ForecastOriginationPoint) document what was enforced into the DEM and are the primary QC record for the conditioning decisions. Network layers (StreamLine, StreamLine3D, StreamLine3D_Smooth, DrainageLinePointSplit, DrainageLineSplit, Catchment, AdjointCatchment) carry the Arc Hydro network attribution and form the analysis backbone.
Two kinds of tables support the feature classes. APUNIQUEID is the Arc Hydro identity ledger: one row per ID variable (IDNAME) storing the last value issued (LASTID) – in this workflow, a single row for HydroID – which guarantees that HydroIDs are unique across the geodatabase. The four flow split tables (StreamLine_FS, StreamLine3D_FS, DrainageLineSplit_FS, Catchment_FS) are written by the Find Next Downstream Line and Adjoint Catchment operations; each row (FeatureID, NextDownID) records an additional downstream connection where a feature has more than one – in a fully dendritic configuration these tables are typically empty, and their presence is a useful QC check (rows indicate braids or splits).
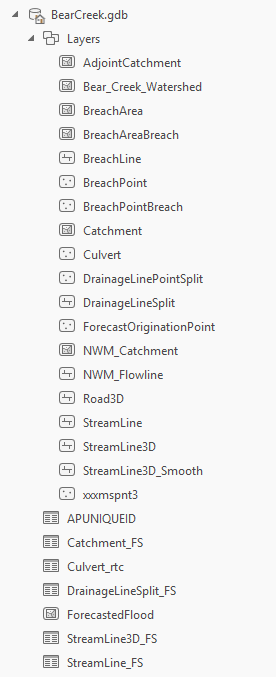
. Project geodatabase overview.
Raster Workspace
Rasters are intentionally kept outside the geodatabase, in the folder of the input DEM, in the DEM’s format. They fall into three groups: conditioning surfaces (breacharea, dem_burn, landform, flat, flatflat, demflatburn, flatburn), tracing surfaces (fdr, fac, fdr_adj, originraster, origincostpath, str, strlnk, str3d), and the analysis-grade foundation used by everything downstream (demthaladj, strlnk2, cat, hand, handgt0, handhealed, unitrun). The intermediate surfaces can be archived or deleted once the project is validated; the foundation rasters – in particular cat and the HAND rasters – are required for flood mapping and should be retained. Appendix 1 (Table 12) lists every raster with the step that creates it.
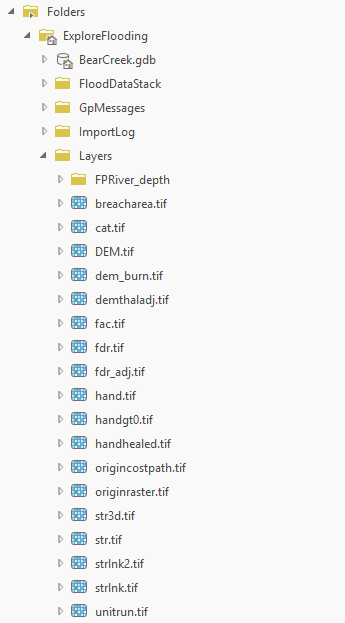
. Raster workspace overview.
Flood Data Stack Geodatabase
FP.gdb is the portable product of the workflow: everything needed to map flooding from a stage or discharge, without re-running terrain processing. FPRiver and FPCatchment are the stack’s own copies of the model streams and catchments, decoupling the stack from later edits to the project geodatabase; FPRiver additionally carries the hydraulic parameters (ManningN, S0) used in rating curve generation, and – after the flow frequency tool runs – the ten rf_* fields. pf_ModelStream is the rating curve and hydraulic property table, one row per stream per slice. FPZoneRiver holds the per-stream, per-slice flood extent polygons (the workhorse for selective rendering), while FPZone holds the merged extent per slice. HTable registers the slices and LogTable preserves the generation parameters, making the stack self-describing.
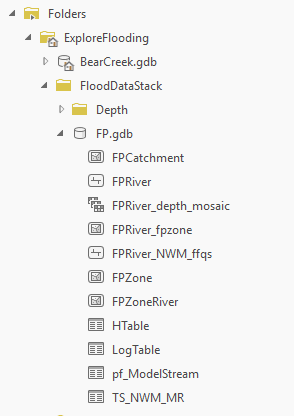
. Flood data stack geodatabase overview.
Key Identifiers and Relationships
A small set of identifier fields ties the whole design together (Table 6). The central convention is that the model stream HydroID doubles as the GridID, and the GridID is the VALUE of the catchment raster; this single number therefore connects a stream feature, its catchment polygon, its catchment raster zone, its rating curve rows, and its flood zone polygons. The forecast identifier (COMID) connects all of these to the external forecast source, and the slice index (HIndex) connects any stage to the precomputed products.
| Field | Defined On | Relationship |
|---|---|---|
| HydroID | All Arc Hydro features | Unique feature identifier issued per geodatabase via APUNIQUEID. |
| GridID | DrainageLineSplit / FPRiver, Catchment / FPCatchment, pf_ModelStream, fpzone outputs | Vector-raster link: set equal to the model stream HydroID and used as the catchment raster VALUE. |
| NextDownID | Stream and catchment features | HydroID of the next downstream feature; encodes the network (-1 at outlets). Extra connections recorded in *_FS tables. |
| PU_Order | Stream features | Processing-unit (river) order supporting ordered traversal and symbology. |
| DrainID | DrainageLineSplit / FPRiver, AdjointCatchment | HydroID of the associated drainage area feature, relating streams and (adjoint) catchments. |
| ID (Forecast ID / COMID) | NWM_Catchment (input), DrainageLineSplit / FPRiver | NWM reach identifier conflated onto model streams; join key to forecast discharges. |
| feature_id_long | FPRiver_NWM_ffqs | Numeric NWM reach key used to transfer downloaded discharges to streams by COMID. |
| StreamID / RiverID | FPCatchment, FPZoneRiver, fpzone outputs / pf_ModelStream | Reference back to the model stream HydroID from stack and floodplain records. |
| HIndex, HValue | HTable, pf_ModelStream, FPZone, FPZoneRiver | Flood slice index and its stage; HIndex selects the precomputed slice products for a given stage. |
| CompositeID | FPZoneRiver | Combined stream and slice key for direct lookup of a single stream-slice polygon. |
| H_Field | FPRiver_fpzone | Names the return period stage (rf_*_h) a floodplain polygon and depth raster represent. |
. Key identifier fields and the relationships they implement.
Using Floodplains and Rating Curves Practically
Everything computationally intensive in HAND-based flood mapping happens once, during preprocessing. At use time, flood questions reduce to attribute queries and simple raster algebra. This chapter describes the core lookup patterns and the principal use cases they enable.
Core Lookup Patterns
From stage to flood extent and depth. Given a stage H on a model stream (from a gauge, model, or forecast), select the FPZoneRiver polygons where StreamID matches the stream and HIndex corresponds to the slice at or below H – an instantaneous, precomputed extent. Where actual depth values are needed, compute H minus HAND within the stream’s catchment (cells with negative results are dry). Because every model stream is evaluated in its own catchment, adjacent reaches can display different stages simultaneously.
From discharge to stage. Given a discharge Q for a stream, read its rating curve rows from pf_ModelStream (RiverID = HydroID) and interpolate H from the bracketing Q values – exactly the operation the Map NWM Retrospect FF Qs tool automates for the five flow frequency discharges. Any other flow source (regulatory flows, model output, what-if values) can be mapped the same way.
From observation to stage and flow. The relationships also invert: a surveyed high-water mark or an observed wet/dry boundary corresponds to a HAND value, which is an estimate of the local stage; the rating curve then estimates the discharge that produced it.
Creating Floodplains Based on Return Periods
Return period floodplains and depth rasters support screening-level planning: identifying assets, parcels, and road segments exposed at each return period; comparing HAND-based extents with published regulatory floodplains; and providing context for culvert and crossing design (the breach area statistics from hydro conditioning pair naturally with the return period flows at the same locations). These products are planning-level approximations – they do not replace detailed hydraulic studies.
The Arc Hydro tool Map NWM Retrospect FF Qs (Arc Hydro Tools Pro > H & H Modeling > NWM Time Series Processing) automates this process. It consumes the flood data stack: it downloads National Water Model retrospective flow frequency discharges (2-, 5-, 10-, 25-, and 50-year return periods), converts them to stages using the rating curves, and maps the resulting flood depths and extents as rasters and polygons organized in a mosaic dataset and feature class.
This tool demonstrates the primary use of the flood data stack, mapping the flow frequency discharges onto the streams produced by the terrain processing workflow. Subsection numbering below matches the tool’s run-time messages.
Inputs are typically the outputs of the Dendritic Batch Process (Table 7). The stream layer must carry HydroID, the forecast identifier (COMID) field, and GridID values matching the catchment raster; the rating curve table must relate stage to discharge per stream via RiverID, H, and Q – the pf_ModelStream table satisfies this directly. Horizontal and vertical units of all inputs must be consistent. The tool converts the downloaded discharges (cfs) based on the horizontal spatial reference of the stream layer (dividing by 35.3198 to obtain cms when the projection is in meters).
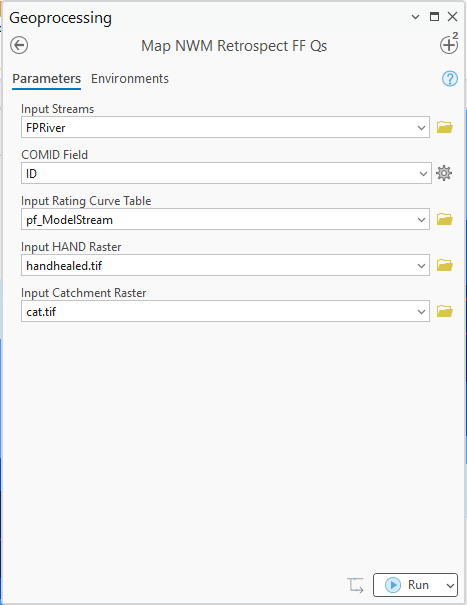
. Map NWM Retrospect FF Qs tool user interface.
| Parameter | Description | Type |
|---|---|---|
| Input Streams | Stream feature layer to map (e.g., FPRiver). Requires HydroID, the Forecast ID (Dendritic Batch Process tool calculates this as ID), and GridID. | Feature Layer |
| COMID Field | Field containing the NWM forecast unique identifier (ID in this case) | Field |
| Input Rating Curve Table | Rating curve table with RiverID, H, and Q (e.g., pf_ModelStream). | Table View |
| Input HAND Raster | HAND raster (handhealed or handgt0). | Raster Layer |
| Input Catchment Raster | Catchment raster whose VALUE matches the stream GridID (cat). | Raster Layer |
| Output Feature Layer with Design Qs (derived) | Input stream layer with rf_*_q and rf_*_h fields populated. | Feature Layer |
| Output Mosaic Floodplains (derived) | Mosaic dataset referencing the return period depth rasters. | Mosaic Dataset |
| Output FPZone Polygon (derived) | Floodplain extent polygons per stream and return period. | Feature Layer |
. Map NWM Retrospect FF Qs parameters.
Downloading NWM Flow Frequency Values
The Download NWM Retrospect FF Qs tool retrieves the NWM retrospective flow frequency (design discharge) values for the reaches matching the stream layer’s forecast IDs and writes them, with NWM reach geometry, to a reference feature class named \<Streams>_NWM_ffqs (FPRiver_NWM_ffqs in the tutorial). Downloaded discharge fields are renamed to rf_2_q, rf_5_q, rf_10_q, rf_25_q, and rf_50_q while their aliases retain the NWM descriptions ("50% Streamflow (cfs)" for the 2-year flow, and so on); NWM metadata fields (feature_id, name, strm_order, huc6, nwm_vers, high_water_threshold) are preserved and feature_id_long provides a numeric join key. Note the geometry of these reaches matches the NWM representation, not the model streams – the relationship is by forecast ID.
Transferring Discharges to the Stream Layer
Ten double fields (rf_2_q … rf_50_q and rf_2_h … rf_50_h) are added to the input stream layer if not present. Each stream feature receives the five return period discharges of its NWM reach (matched on the COMID field), converted from cfs to the map unit flow (divided by 35.3198 when the spatial reference is metric).

. FPRiver attribute table after the field transfer.
Converting Discharges to Stages
For every stream feature, the rating curve records with RiverID equal to the feature’s HydroID are read (ordered by descending Q), and each return period discharge is converted to a stage by interpolation between the bracketing rating curve points (extrapolated when the discharge falls outside the curve). Results populate rf_2_h … rf_50_h – stages in map units above the channel thalweg, directly comparable to the HAND raster.
Building the Stream-to-Catchment Stage Table
A scratch mapping table (hidtoh_table) is created with one row per stream: HydroID, GridID, and the five stages stored as long integers multiplied by 100 (two implied decimals, saving space). This table drives the raster reclassification in the next step.
Mapping Depth Rasters and Floodplain Polygons
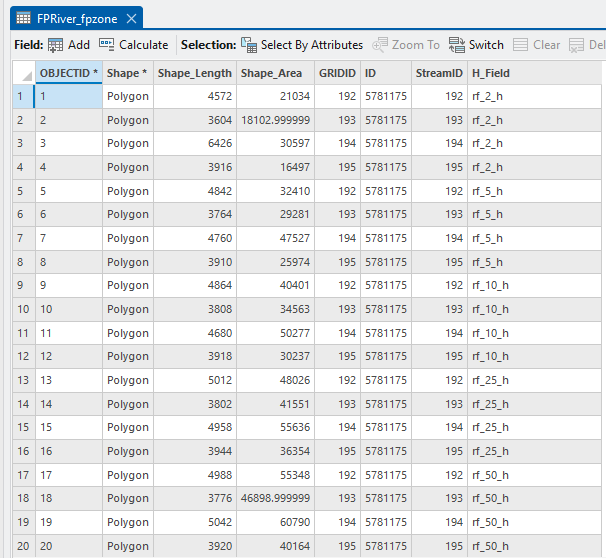
For each return period, the catchment raster is reclassified by GridID to the stage of its stream (Reclass By Table, divided by 100 to restore decimal stages), producing a water surface (stage) raster in HAND space. Subtracting HAND yields the flood depth raster; cells with negative depth are removed. The depth raster is saved as rf_\<n>_h in a \<Streams>_depth folder created next to the catchment raster. The flooded area (depth > 0) is intersected with the catchment raster, converted to polygons without simplification, and dissolved per catchment; the polygons are appended to the \<Streams>_fpzone feature class with GRIDID, the forecast ID, StreamID (the stream HydroID), and H_Field (the return period stage field name, e.g., rf_10_h).
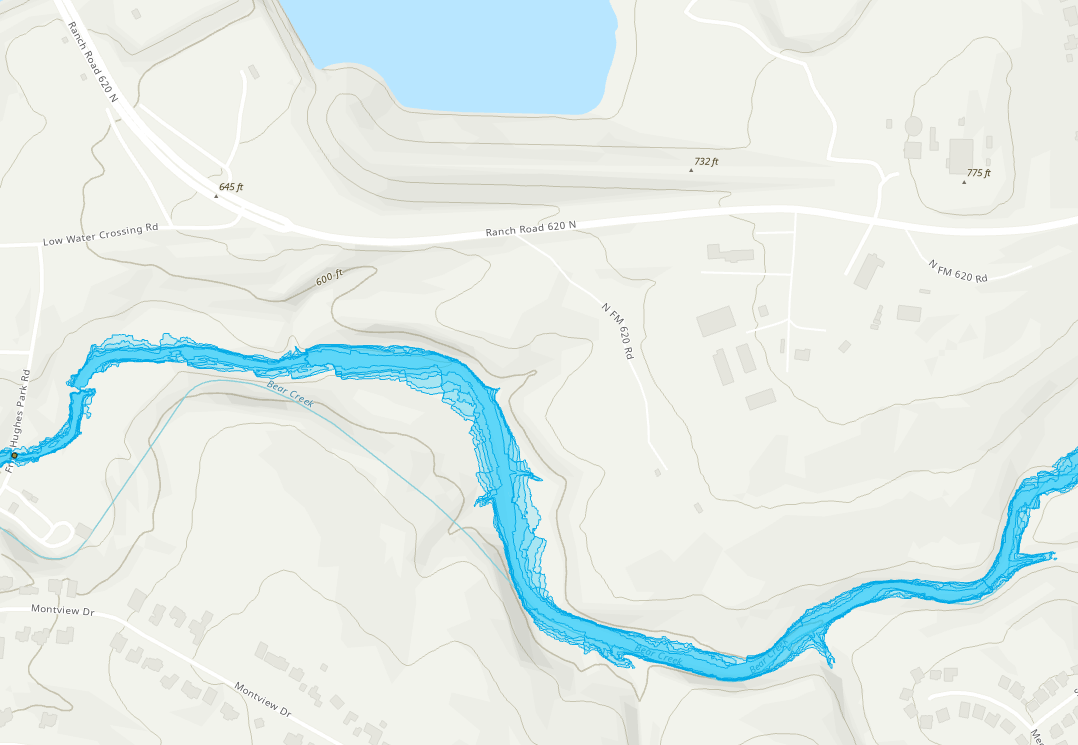
. FPRiver_fpzone output.
. FPRiver_fpzone attribute table.
Building the Depth Mosaic Dataset
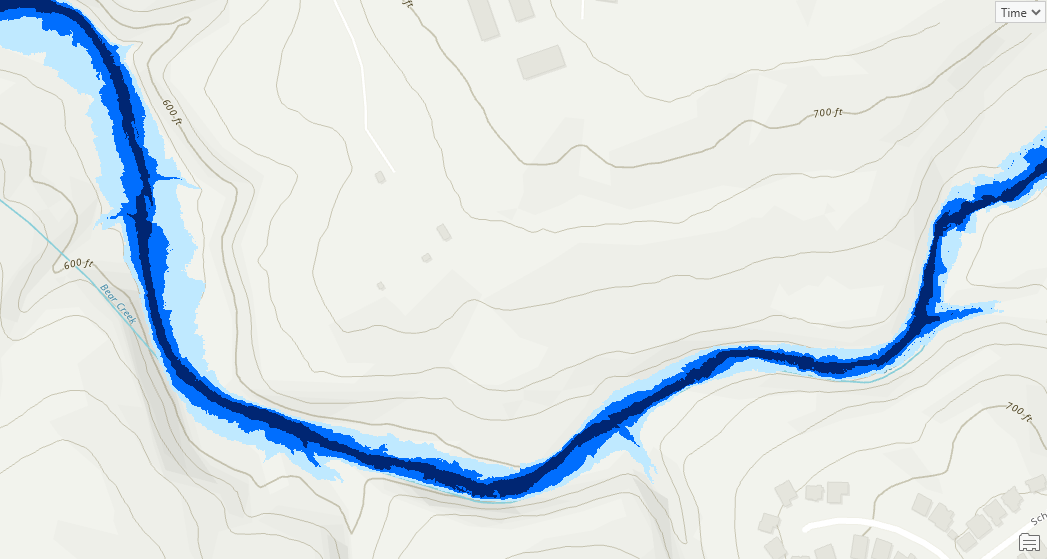
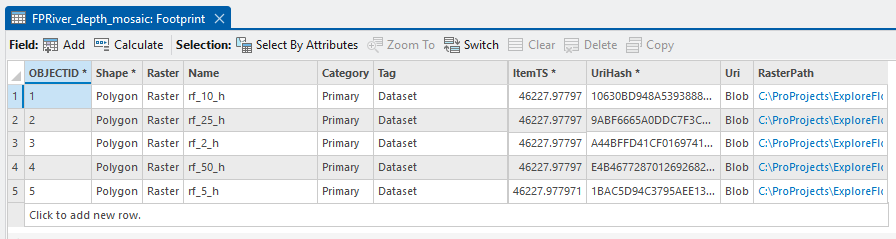
All return period depth rasters are registered in a mosaic dataset named \<Streams>_depth_mosaic created in the project geodatabase (an existing mosaic dataset is first emptied and removed so the referenced rasters can be overwritten). The Name field of each mosaic item matches the stage field it represents (rf_2_h, rf_5_h, …), and a RasterPath field records the folder holding the depth rasters. The mosaic dataset provides a single layer from which any return period floodplain can be displayed or queried.
. Mosaic dataset output.
. Mosaic dataset table, with each raster representing a different return period flood extent.
Outputs Summary
| Output | Container | Description |
|---|---|---|
| FPRiver (updated) | FP.gdb | Input streams with rf_*_q discharges (map units) and rf_*_h stages populated. |
| FPRiver_NWM_ffqs | FP.gdb | NWM reach geometry with downloaded flow frequency values (cfs) and NWM metadata. |
| FPRiver_fpzone | FP.gdb | Floodplain extent polygons per catchment and return period (GRIDID, ID, StreamID, H_Field). |
| FPRiver_depth_mosaic | FP.gdb | Mosaic dataset referencing the five return period depth rasters. |
| rf_2_h … rf_50_h rasters | FPRiver_depth folder | Flood depth rasters, one per return period, in DEM format and vertical units. |
. Map NWM Retrospect FF Qs outputs (tutorial names, input streams = FPRiver).
Creating Time-Enabled Floodplains Based on a Forecast
The flood data stack turns forecast flood mapping into a lookup problem. A forecast provides a discharge per NWM reach per time step; discharges are converted to stages through the rating curves, stages to flood slice indices, and slice indices to the precomputed FPZoneRiver polygons – producing a time-stamped sequence of floodplains. Because the per-time-step work is a table join rather than a computation, the approach scales to frequent forecast refreshes and long forecast horizons.
The Arc Hydro tool NWM Flood Extent Forecast (Arc Hydro Tools Pro > H & H Modeling > NWM Time Series Processing) automates the complete sequence: it downloads the NWM forecast discharge time series for the reaches in the stream layer and constructs the time-stamped floodplain extents by joining the forecast to the precomputed flood data stack.
The tool operates entirely on flood data stack products – no rasters are touched at forecast time. FPRiver supplies the reaches (the COMID field relates them to the NWM forecast, and HydroID relates them to the rating curves), FPZoneRiver supplies the precomputed per-slice flood extent polygons, and pf_ModelStream supplies the Q-H rating curves. The Slice Increment parameter must match the stage increment (delta h) used when the flood data stack was created (for example, 0.3048 for 1-foot slices in a metric project), because it converts each computed stage into the slice index (HIndex) and composite key (CompositeID = StreamID x 100 + HIndex) that select the matching FPZoneRiver polygons. The table below lists the tool parameters.
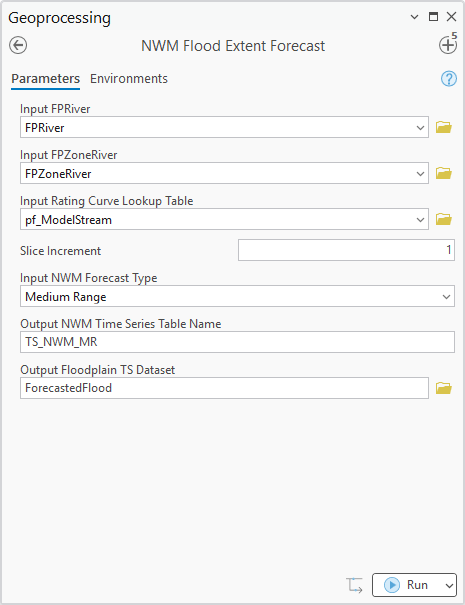
. NWM Flood Extent Forecast tool user interface.
| Parameter | Description | Type |
|---|---|---|
| Input FPRiver | Model stream (river) lines from the flood data stack, carrying the NWM reach identifier (feature_id / ID = COMID) and HydroID. | Feature Layer |
| Input FPZoneRiver | Precomputed per-stream flood slice polygons from the flood data stack, keyed by StreamID, HIndex, HValue, and CompositeID (= StreamID x 100 + HIndex). | Feature Layer |
| Input Rating Curve Lookup Table | Rating curve table whose Q and H fields map discharge to stage (pf_ModelStream). | Table View |
| Slice Increment | Stage increment (delta h) used to create the flood data stack (e.g., 0.3048). Defaults to 0.3048 when not supplied. | Double |
| Input NWM Forecast Type | Short Range: forecast at 1-hour intervals for 18 hours. Medium Range: forecast at 3-hour intervals for 80 hours. | String |
| Output NWM Time Series Table Name | Name of the downloaded discharge time series table; created in the workspace of the input FPRiver layer. | String |
| Output Floodplain TS Dataset (derived) | Output time-enabled floodplain extent polygons. | Feature Layer |
. NWM Flood Extent Forecast parameters.
Downloading NWM Forecast Discharges
The Download NWM Q Values operation retrieves the forecast discharge time series for every reach in the stream layer (matched on the COMID field) from the NWM forecast services – the short range service (hourly values for the next 18 hours) or the medium range service (3-hourly values for the next 80 hours), per the Forecast Type parameter – and writes them to the time series table in the FPRiver workspace, one record per reach per forecast time step.
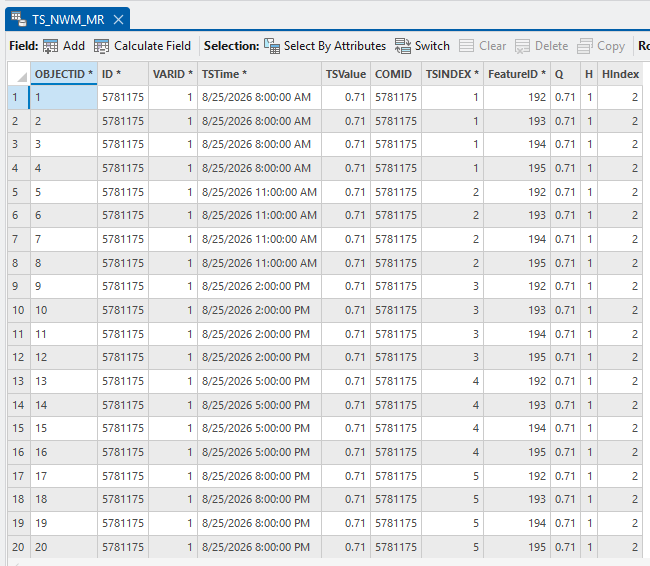
. Downloaded NWM medium range forecast flows for the input streams.
Constructing Time-Stamped Floodplain Extents
The Update Floodplain Extent TS Table operation walks the downloaded time series and, for each reach and time step, converts the forecast discharge to a stage by interpolating the reach’s rating curve records (RiverID = HydroID), divides the stage by the Slice Increment to obtain the flood slice index (HIndex), and assembles the composite key (CompositeID = StreamID x 100 + HIndex) to join the matching precomputed FPZoneRiver polygons. The joined features are written to the output floodplain time series dataset: flood extents per model stream per forecast time step, each stamped with its forecast time and stage.
Enabling time on the output dataset turns it directly into an animation: the time slider steps through the forecast, and the same layer can be published as a time-enabled service that is refreshed by rerunning the tool on each NWM forecast cycle.
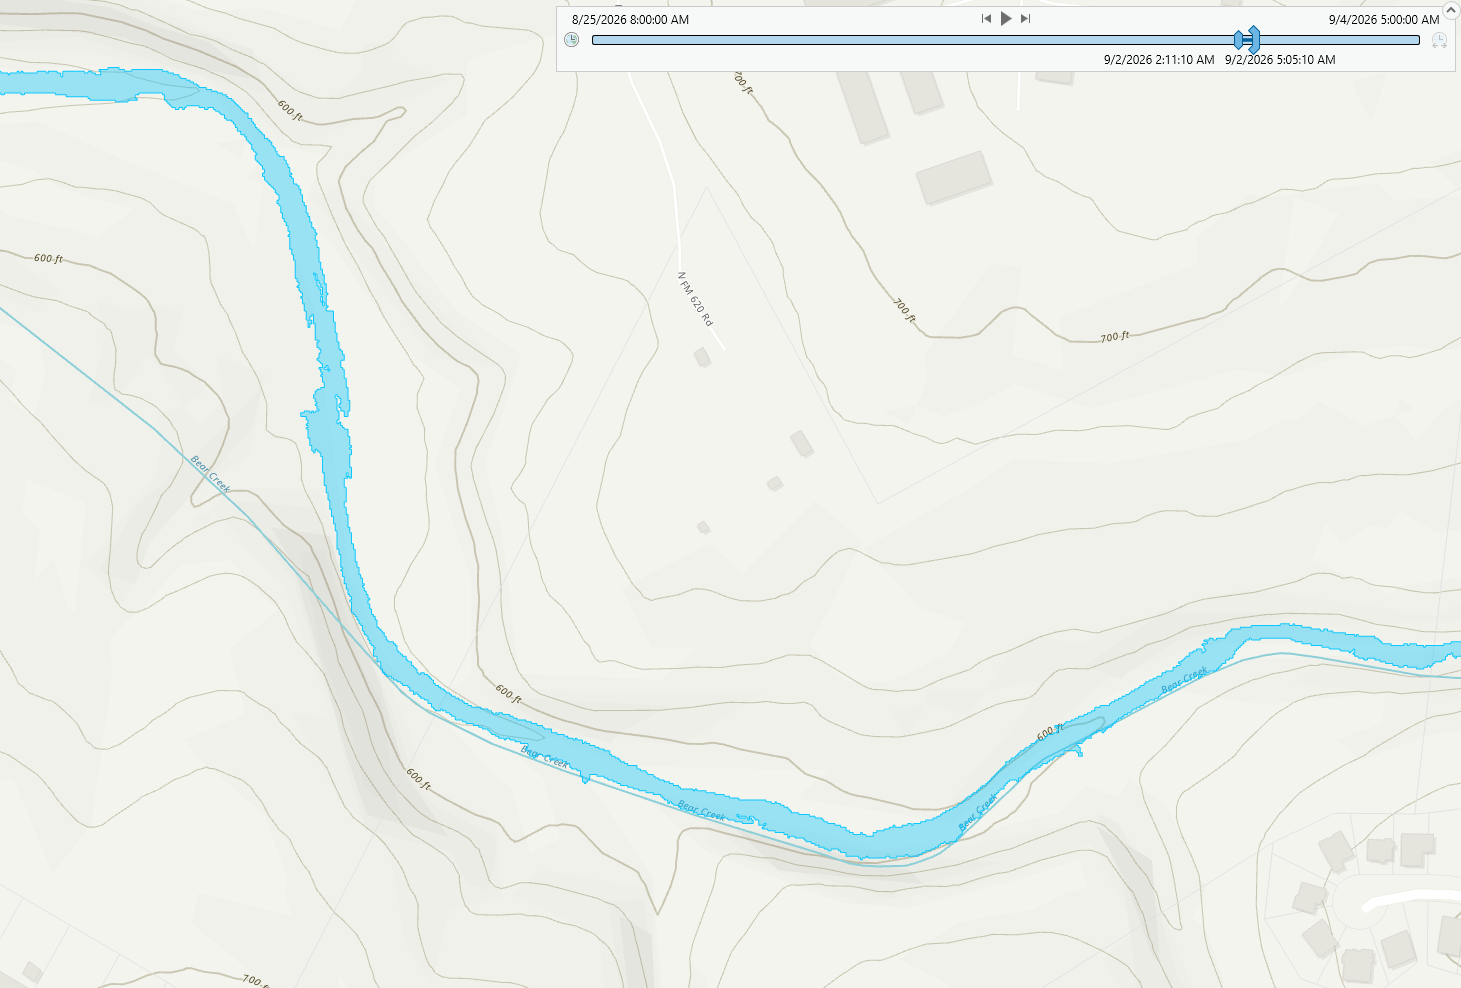
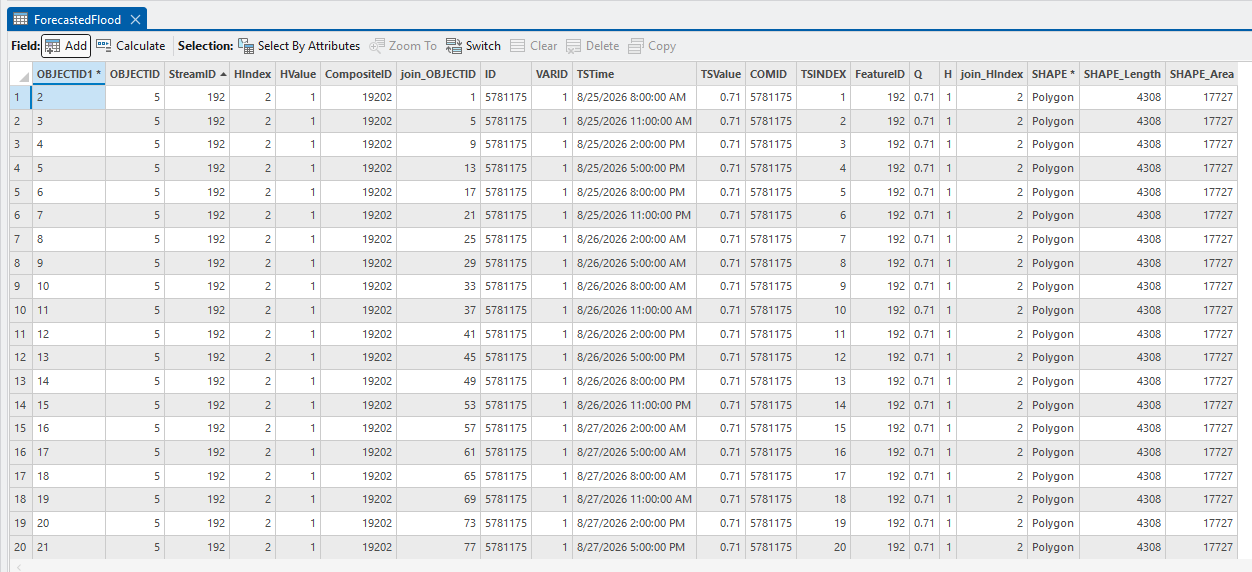
. Time-enabled output flood extent layer.
. Attribute table of the time-enabled floodplain feature layer.
Outputs Summary
| Output | Container | Description |
|---|---|---|
| NWM Q time series table | FPRiver workspace (FP.gdb) | Downloaded NWM forecast discharges, one record per reach per forecast time step; refreshed on each run. |
| Floodplain TS dataset | As specified in the tool | Time-stamped floodplain extent polygons per model stream per time step; the layer to time-enable and animate. |
. NWM Flood Extent Forecast outputs.
Downloading Forecasts on a Schedule
Since forecasts from the NWM are refreshed hourly or every six hours depending on the model, the NWM Flood Extent Forecast tool can be scheduled to run automatically. This way the forecasted flood extents are always reflecting the latest forecast information and can be used in an operational manner.
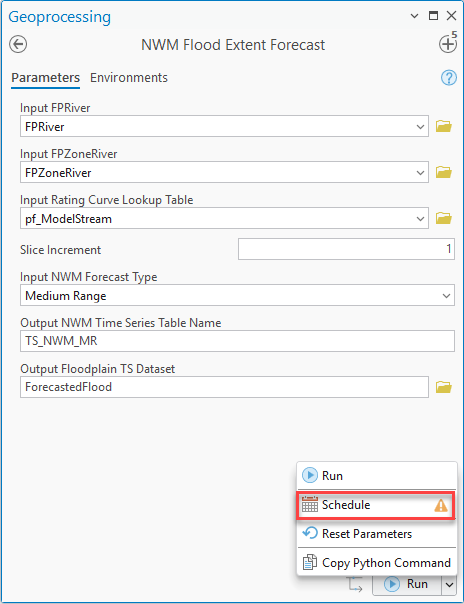
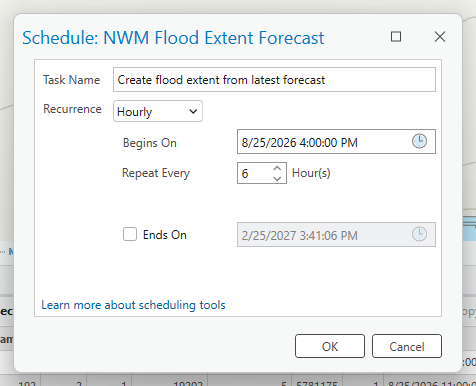
. Scheduling the tool to run automatically.
. Setting the tool to run every six hours for the medium range model.
Because the medium-range model is selected as the forecast type, the tool is scheduled to run every six hours to align with the forecast update cycle. Ideally, each run should begin shortly after new forecast data becomes available in ArcGIS Living Atlas, typically at approximately 2:45 a.m., 6:45 a.m., 2:45 p.m., and 8:45 p.m. Pacific Time. If the short-range model is used, schedule the tool to run hourly to match its update cycle.
Scheduling the tool through the ArcGIS Pro user interface creates a task in Windows Task Scheduler. The task can then be modified in Task Scheduler to configure additional permissions and operating-system settings for the user’s machine.
Note that scheduling the tool overwrites the forecast flood extent feature class with the latest forecast information after each run. To retain the output from each forecast run, it is possible to archive it to a separate feature class using Python or an additional task in Windows Task Scheduler.
Real-Time Flood Rendering from Observations
Ground truth observations – gauge readings or field-reported water surface elevations – can drive the same rendering path without any forecast: the observed stage at a location is translated to the local model stream’s stage, and the corresponding slice polygons render the current situation for the surrounding reaches. Where observations and forecasts disagree, the observed stage can locally override the forecast-derived stage, improving the depiction as an event unfolds. This approach has been implemented for emergency management agencies that need real-time flood extents from boots-on-the-ground observations. For more information, refer to the Texas Division of Emergency Management’s Pin2Flood application, which leverages this approach.
Post-Event Damage Assessment
After an event, surveyed high-water marks anchor the reconstruction of peak conditions: each mark yields a peak stage for its reach, the stack yields the corresponding peak extent and depth surface, and overlaying structures on the depth surface supports depth-based damage estimation. The reconstructed stages and the rating curves also provide peak discharge estimates at ungauged locations, useful for validating and improving both the forecast model and the stack itself (for example, revisiting ManningN values where reconstructed and forecast flows diverge).
Conclusion
This document described the Arc Hydro terrain processing workflow for HAND modeling as implemented by the Dendritic Batch Process tool, from hydro conditioning of the raw DEM through generation of the flood data stack and synthetic rating curves, and outlines some of the many use cases for this dataset. The hard-coded, convention-driven database design – a project geodatabase for the network foundation, a raster workspace for the surfaces, and a portable flood data stack geodatabase – is what allows the products to be consumed by downstream applications without bespoke configuration. The use cases outlined in Chapter 6 (forecast-driven and time-enabled flood mapping, real-time rendering from observations, and post-event assessment) will be expanded in subsequent documents.
Because the Dendritic Batch Process chains together the Arc Hydro and Spatial Analyst tools described in Chapter 4, users can also run any of these tools individually. This approach provides greater flexibility and more control over parameters that the Dendritic Batch Process hard-codes for simplicity.
Appendix 1. Terrain Preprocessing and HAND Data Dictionary
This appendix inventories the datasets created by the workflow and the fields they carry. Dataset schemas reflect the geodatabase design reports generated from the Bear Creek tutorial project.
Element Inventory
| Element | Type | Key Fields | Description / Comments |
|---|---|---|---|
| NWM_Flowline | Line FC | featureID | Input forecast (NWM) streams; origination points seed stream definition. |
| NWM_Catchment | Polygon FC | ID | Input forecast catchments; source of the forecast ID conflated onto model streams. |
| ForecastOriginationPoint | Point FC | ORIG_FID | Start vertices of forecast streams; seeds for optimal path stream tracing. |
| BreachArea / BreachAreaBreach | Polygon FC | gridcode | All identified depressions / the subset selected for breaching; depression statistics (AREA, MIN, MAX, RANGE, MEAN, SUM, VOLUME, Compactness). |
| BreachPoint / BreachPointBreach | Point FC | gridcode | Deepest point of each depression (POINT_X/Y, ELEVATION) / subset within selected breach areas. |
| BreachLine | Line FC (3D) | SRC_OID | Generated breach lines burned into the DEM; endpoint values and coordinates (FROM_VAL/TO_VAL, FROM_X/Y, TO_X/Y). |
| InCulvert_Adj | Line FC | - | Endpoint-adjusted copy of the input draft culverts (created when culverts are provided); appended to BreachLine. |
| AHFlatPoly / AHFlatPolyBurn | Polygon FC | gridcode | Identified flat areas / subset intersecting forecast streams that was burned (created when flat areas are detected). |
| StreamLine | Line FC | HydroID, NextDownID | Draft streams from stream definition with Arc Hydro network attribution. |
| StreamLine3D / StreamLine3D_Smooth | Line FC (3D) | HydroID, Line2DID | 3D streams draped on the conditioned DEM / smoothed monotonic thalweg (FROMZ, TOZ). |
| DrainageLinePointSplit | Point FC | ORIG_FID | Equidistant split points used to partition draft streams. |
| DrainageLineSplit | Line FC | HydroID, GridID, ID | Model streams: the HAND analysis units, with forecast ID conflated and GridID = HydroID. |
| Catchment | Polygon FC | GridID, HydroID | Local catchment of each model stream (vectorized cat raster). |
| AdjointCatchment | Polygon FC | HydroID, DrainID | Aggregated upstream areas for fast watershed delineation. |
| APUNIQUEID | Table | IDNAME, LASTID | Arc Hydro identity ledger; guarantees geodatabase-unique HydroIDs. |
| StreamLine_FS, StreamLine3D_FS, DrainageLineSplit_FS, Catchment_FS | Tables | FeatureID, NextDownID | Flow split records (additional downstream connections). Typically empty in dendritic projects; rows flag braids/splits. |
. Terrain preprocessing project geodatabase element inventory.
| Raster | Step | Description |
|---|---|---|
| breacharea | 2.1 | Depression zones evaluated for breaching. |
| dem_burn | 2.6 | DEM with consolidated breach lines burned in. |
| landform / flat | 3.1 | Landform classification / extracted flat-class cells. |
| flatflat | 3.2 | Rasterized selected flat polygons (those intersecting forecast streams). |
| demflatburn / flatburn | 3.3 | DEM with flat areas enforced / burned flat surface by-product. |
| fdr / fac | 4 | D8 flow direction / flow accumulation from the conditioned DEM. |
| originraster | 5.1 | Forecast origination points snapped to highest accumulation within 50 units. |
| fdr_adj | 5.1 | Flow direction with undefined values (255) replaced by 0 for path tracing. |
| origincostpath | 5.1 | Optimal downstream paths traced from origination points. |
| str / strlnk | 5.1 | Draft stream cells / stream links segmented at confluences. |
| str3d | 5.4 | Smoothed thalweg elevations rasterized with MINIMUM assignment. |
| demthaladj | 5.5 | Thalweg-adjusted DEM: input DEM with the smoothed channel bottom mosaicked in. Elevation reference for HAND. |
| strlnk2 | 6.1 | Model stream link raster (VALUE = model stream HydroID / GridID). |
| cat | 6.2 | Catchment raster (VALUE = GridID). Required for all flood mapping. |
| hand | 6.3 | Raw height above nearest drainage. |
| handgt0 | 6.3 | HAND with negative / near-zero rounding artifacts set to 0. |
| handhealed | 6.3 | HAND healed along breach cuts (created when Use Healed HAND is checked). |
| unitrun | 6.3 | Unit run slope along flow direction; energy slope for rating curves. |
. Raster inventory (names carry the input DEM extension; created in the Layers folder).
| Element | Type | Key Fields | Description / Comments |
|---|---|---|---|
| FPRiver | Line FC | HydroID, GridID, ID | Stack copy of the model streams with ManningN and S0; receives rf_*_q / rf_*_h fields from the flow frequency tool. |
| FPCatchment | Polygon FC | GridID, StreamID | Stack copy of the catchments, related to FPRiver via StreamID / GridID. |
| HTable | Table | HIndex, HValue, ISDONE | Registry of flood slices and completion flags (restartability). |
| FPZone | Polygon FC | HIndex, HValue | Merged flood extent per slice. |
| FPZoneRiver | Polygon FC | StreamID, HIndex, HValue, CompositeID | Flood extent per model stream per slice; primary layer for selective / forecast rendering. |
| pf_ModelStream | Table | RiverID, HIndex, H, Q | Synthetic rating curves and per-slice hydraulic properties (Length_m, B, R, A, P). |
| LogTable | Table | ParamName, ParamDesc | Parameters of the stack generation run. |
| FPRiver_NWM_ffqs | Line FC | feature_id_long | Downloaded NWM reaches with flow frequency discharges (cfs) and NWM metadata. |
| FPRiver_fpzone | Polygon FC | GRIDID, StreamID, H_Field | Return period floodplain polygons per catchment. |
| FPRiver_depth_mosaic | Mosaic dataset | Name, RasterPath | References the return period depth rasters in the FPRiver_depth folder. |
. Flood data stack geodatabase (FP.gdb) element inventory.
Field Inventory
Description of individual fields across the workflow outputs.
| Field | Type | Found On | Description / Comments |
|---|---|---|---|
| HydroID | Long | All Arc Hydro features | Arc Hydro unique feature identifier (issued via APUNIQUEID). |
| NextDownID | Long | Streams, catchments | HydroID of the next downstream feature; -1 at outlets. |
| from_node / to_node | Long | Stream FCs | Node identifiers from Generate From/To Node; basis for NextDownID. |
| PU_Order | Long | Stream FCs | Arc Hydro processing-unit (river) order classifier. |
| arcid / grid_code | Long | Stream FCs | Raster lineage identifiers from Stream To Feature; not maintained downstream. |
| LineSplitDistance | Double | StreamLine, DrainageLineSplit | Computed equidistant split interval for the parent stream. |
| ORIG_FID / ORIG_SEQ | Long | Split features | Source feature OID / segment sequence from splitting operations. |
| GridID | Long | Model streams, catchments, stack tables | Raster link identifier; equals model stream HydroID and catchment raster VALUE. |
| ID | Long | NWM_Catchment, DrainageLineSplit, FPRiver | Forecast (NWM COMID) identifier; field name follows the input Forecast ID field. |
| DrainID | Long | DrainageLineSplit, FPRiver, AdjointCatchment | HydroID of the associated drainage area feature. |
| LengthKM | Double | DrainageLineSplit, FPRiver | Segment length in kilometers. |
| Id / gridcode | Long | Breach and flat FCs | Zone identifiers from raster-to-vector conversion. |
| AREA, MIN, MAX, RANGE, MEAN, SUM | Double | BreachArea*, BreachPoint* | Depression statistics; RANGE (maximum depth) is tested against the Breach Area Depth Limit. |
| VOLUME, Compactness | Float / Double | BreachArea*, BreachPoint* | Depression storage volume and shape compactness. |
| POINT_X, POINT_Y, ELEVATION | Double / Float | BreachPoint* | Coordinates and elevation of the depression’s deepest point. |
| SRC_OID, FROM_VAL, TO_VAL, FROM_X/Y, TO_X/Y | Long / Double | BreachLine | Source breach point OID; endpoint elevations and coordinates of the breach line. |
| Line2DID | Long | StreamLine3D(_Smooth) | HydroID of the source 2D stream line. |
| FROMZ, TOZ | Double | StreamLine3D_Smooth | Endpoint elevations after smoothing. |
| FeatureID | Long | *_FS tables | HydroID of the feature the flow split record belongs to. |
| IDNAME, LASTID | Text / Long | APUNIQUEID | Layer name and last HydroID issued for it. |
| ParamName, ParamDesc | Text | LogTable | Flood stack run parameter name and value. |
| HIndex | Long | HTable, pf_ModelStream, FPZone(River) | Flood slice index (0..N). |
| HValue | Double | HTable, FPZone(River) | Slice stage in DEM vertical units above the thalweg. |
| ISDONE | Long | HTable | Slice completion flag (restartability). |
| StreamID | Long | FPCatchment, FPZoneRiver, fpzone outputs | HydroID of the related model stream. |
| RiverID | Long | pf_ModelStream | HydroID of the stream a rating curve row belongs to (join to FPRiver.HydroID). |
| Length_m | Double | pf_ModelStream | Model stream segment length in meters. |
| H, Q | Double | pf_ModelStream | Stage and Manning-derived discharge of the slice record (the rating curve pair). |
| B, A, P, R | Double | pf_ModelStream | Top width, wetted area, wetted perimeter, hydraulic radius at the slice stage. |
| ManningN, S0 | Double | FPRiver | Roughness coefficient and slope used in rating curve computation. |
| CompositeID | Long | FPZoneRiver | Combined stream / slice lookup key. |
| rf_2_q … rf_50_q | Double | FPRiver, FPRiver_NWM_ffqs | Return period discharges (cfs as downloaded; converted to map units on FPRiver). |
| rf_2_h … rf_50_h | Double | FPRiver | Stages for the return period discharges, interpolated from the rating curves. |
| feature_id / feature_id_long | Text / Long | FPRiver_NWM_ffqs | NWM reach identifier (text as delivered / numeric join key). |
| name, strm_order, huc6, nwm_vers | Text / Double | FPRiver_NWM_ffqs | NWM reach metadata (name, stream order, HUC6, NWM version). |
| high_water_threshold | Double | FPRiver_NWM_ffqs | NWM high water threshold discharge (cfs); useful alerting trigger. |
| H_Field | Text | FPRiver_fpzone | Return period stage field (rf_*_h) the polygon represents. |
| featureID, order_, NHDWaterbo, LENGTH_GEO | Long / Double | NWM_Flowline, ForecastOriginationPoint | Source NWM flowline attributes carried through to derived points. |
. Terrain preprocessing and HAND field inventory.