Processor Nearest Coordinate#
Table of Contents#
[ ]:
import bdt
bdt.auth("bdt.lic")
from bdt.functions import *
from bdt.processors import *
from pyspark.sql.functions import *
import geopandas
import folium
import mapclassify
import matplotlib
BDT has been successfully authorized!

            Welcome to
             ___    _                ___         __             ______             __   __     _   __
            / _ )  (_)  ___ _       / _ \ ___ _ / /_ ___ _     /_  __/ ___  ___   / /  / /__  (_) / /_
           / _  | / /  / _ `/      / // // _ `// __// _ `/      / /   / _ \/ _ \ / /  /  '_/ / / / __/
          /____/ /_/   \_, /      /____/ \_,_/ \__/ \_,_/      /_/    \___/\___//_/  /_/\_\ /_/  \__/
                      /___/

BDT python version: v3.5.0-v3.5.0
BDT jar version: v3.5.0-v3.5.0
Part 1: What is Processor Nearest Coordinate#
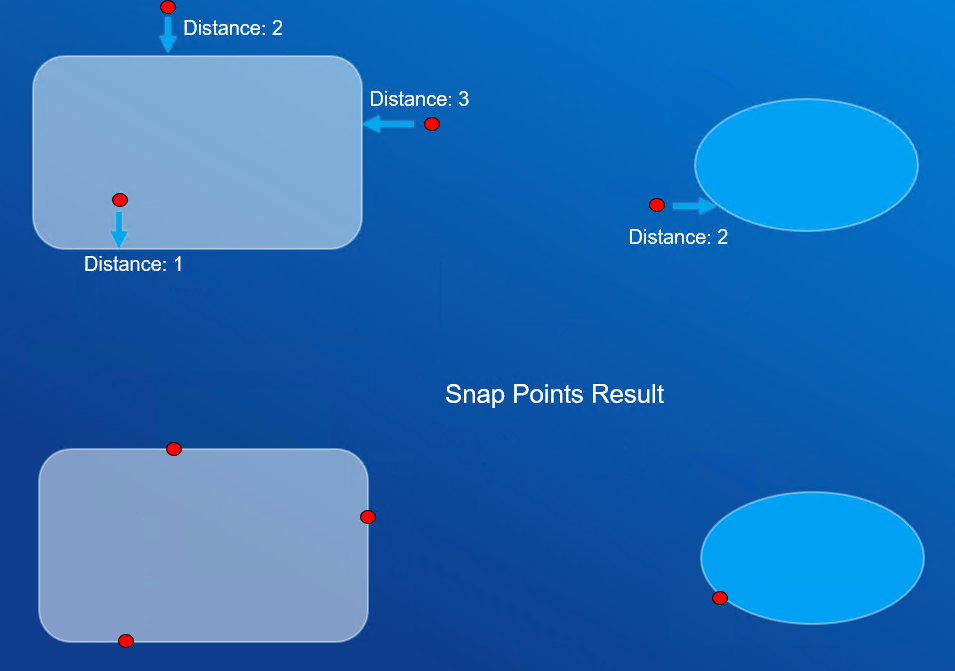
Processor Nearest Coordinate finds the nearest coordinates between two dataframes by taking the left-hand-side dataframe and augmenting it with the closest feature attributes on the right-hand-side dataframe.
The LHS dataframe must be points, the RHS dataframe can be a points, polylines, or polygons.
The input features must be in a projected coordinate system that is appropriate for distance calculations.
Below is a simple example of two polygons and a set of points. The function calculates the distance of the nearest coordinate as well as returning the snapped coordinates.
Part 2: Processor Nearest Coordinate Input Data#
Use WKT strings to create sample points and a polygon around the Esri campus in Redlands.
[ ]:
poly_df = spark.createDataFrame(
    [
        (1, "POLYGON((-117.199866 34.059128, -117.196162 34.059066, -117.196245 34.055853, -117.199716 34.055833, -117.199866 34.059128))"),
        (2, "POLYGON((-117.191012 34.059453, -117.191055 34.057439, -117.193252 34.057202, -117.194477 34.058044, -117.194177 34.058832, -117.192929 34.059317, -117.191012 34.059453))")
    ],
    schema="polyid int, WKT string"
)\
.selectExpr("polyid", "ST_FromText(WKT) AS SHAPE") \
.withMeta("POLYGON", 4326, "SHAPE")
poly_df.show()
+------+--------------------+
|polyid|               SHAPE|
+------+--------------------+
|     1|{[01 06 00 00 00 ...|
|     2|{[01 06 00 00 00 ...|
+------+--------------------+
[ ]:
point_df = spark.createDataFrame(
    [
        (1, "POINT(-117.198358 34.056982)"),
        (2, "POINT(-117.198769 34.059076)"),
        (3, "POINT(-117.195690 34.057114)"),
        (4, "POINT(-117.194614 34.055944)"),
        (5, "POINT(-117.194906 34.058528)"),
    ],
    schema="pointid int, WKT string"
)\
.selectExpr("pointid", "ST_FromText(WKT) AS SHAPE") \
.withMeta("POINT", 4326, "SHAPE")
point_df.show()
+-------+--------------------+
|pointid|               SHAPE|
+-------+--------------------+
|      1|{[01 01 00 00 00 ...|
|      2|{[01 01 00 00 00 ...|
|      3|{[01 01 00 00 00 ...|
|      4|{[01 01 00 00 00 ...|
|      5|{[01 01 00 00 00 ...|
+-------+--------------------+
This function allows quick visualizations of Spark dataframes using geopandas and folium.
[ ]:
def explore_geometries(df1, df2, shape_col_name="SHAPE", wkid=4326):
    gdf1 = to_geo_pandas(df1, wkid, shape_col_name)
    gdf2 = to_geo_pandas(df2, wkid, shape_col_name)
    m = gdf2.explore(legend=False, color="blue", tiles="Esri.WorldTopoMap")
    m = gdf1.explore(legend=False, color="red", m=m)
    folium.LayerControl().add_to(m)
    return m
[ ]:
explore_geometries(point_df, poly_df)
Part 3: Using Processor Nearest Coordinate#
The nearestCoordinate function requires the following arguments:
ldf – The left-hand side (LHS) input DataFrame.
rdf – The right-hand side (RHS) input DataFrame.
cellSize (float) – The spatial partitioning cell size.
snapRadius (float) – The snapping radius.
For the full list of optional arguments reference the API documentation.
[ ]:
nearest_coord_df = bdt.processors.nearestCoordinate(
        point_df,
        poly_df,
        cellSize = 1.0,
        snapRadius = 5.0)
The output dataframe has the following columns
pointid - the lhs point dataframe id column
SHAPE - the lhs point dataframe SHAPE column
polyid - the rhs polygon dataframe id column. This id is the closest rhs geometry to the lhs point
distance - the distance from the lhs point to the rhs polygon
X and Y - the XY coordinates for the lhs point snapped to the rhs polygon
isOnRight - True if the closest coordinate is to the right of the polygon. The origin point of polyid 1 is top left, and thus the points are drawn left to right. Therefore, points within the polygon will be considered onRight and points outside will be considered False.
[ ]:
nearest_coord_df.show()
+-------+--------------------+------+--------------------+-------------------+------------------+---------+
|pointid|               SHAPE|polyid|            distance|                  X|                 Y|isOnRight|
+-------+--------------------+------+--------------------+-------------------+------------------+---------+
|      1|{[01 01 00 00 00 ...|     1|0.001141156222067...|-117.19835142473478|34.055840862721205|     true|
|      2|{[01 01 00 00 00 ...|     1|3.363297762713936E-5|-117.19876843710784|34.059109628266924|     true|
|      3|{[01 01 00 00 00 ...|     1| 5.22250922420033E-4| -117.1962120767551| 34.05712748657662|    false|
|      4|{[01 01 00 00 00 ...|     1|0.001628106093456498|-117.19624156313057| 34.05598604411448|    false|
|      5|{[01 01 00 00 00 ...|     2|5.731337236071206E-4|-117.19437037050457| 34.05832408014133|    false|
+-------+--------------------+------+--------------------+-------------------+------------------+---------+
Use a filter and ST_MakePoint to get the snapped points
Then use the explore_geometries function again to visualize
[ ]:
snapped_df = nearest_coord_df.select(
        "pointid",
        "polyid",
        "distance",
        "X",
        "Y",
        "isOnRight"
)\
.filter(col("distance") > 0.0) \
.select("*", st_makePoint("X", "Y").alias("SHAPE"))
snapped_df.show()
+-------+------+--------------------+-------------------+------------------+---------+--------------------+
|pointid|polyid|            distance|                  X|                 Y|isOnRight|               SHAPE|
+-------+------+--------------------+-------------------+------------------+---------+--------------------+
|      1|     1|0.001141156222067...|-117.19835142473478|34.055840862721205|     true|{[01 01 00 00 00 ...|
|      2|     1|3.363297762713936E-5|-117.19876843710784|34.059109628266924|     true|{[01 01 00 00 00 ...|
|      3|     1| 5.22250922420033E-4| -117.1962120767551| 34.05712748657662|    false|{[01 01 00 00 00 ...|
|      4|     1|0.001628106093456498|-117.19624156313057| 34.05598604411448|    false|{[01 01 00 00 00 ...|
|      5|     2|5.731337236071206E-4|-117.19437037050457| 34.05832408014133|    false|{[01 01 00 00 00 ...|
+-------+------+--------------------+-------------------+------------------+---------+--------------------+
[ ]:
explore_geometries(snapped_df, poly_df)