STCoverage#
Table of Contents#
[ ]:
import bdt
bdt.auth("bdt.lic")
from bdt import functions as F
BDT has been successfully authorized!

            Welcome to
             ___    _                ___         __             ______             __   __     _   __
            / _ )  (_)  ___ _       / _ \ ___ _ / /_ ___ _     /_  __/ ___  ___   / /  / /__  (_) / /_
           / _  | / /  / _ `/      / // // _ `// __// _ `/      / /   / _ \/ _ \ / /  /  '_/ / / / __/
          /____/ /_/   \_, /      /____/ \_,_/ \__/ \_,_/      /_/    \___/\___//_/  /_/\_\ /_/  \__/
                      /___/

BDT python version: v3.4.0-v3.4.0
BDT jar version: v3.4.0-v3.4.0
Part 1: What is STCoverage#
STCoverage is a function that provides three different measures of similarity between two input line segments. These measures include:
Coverage fraction
Coverage distance
Cosine similarity
The closer any of these measures are to 1, the more similar the two segments are. We will refer to the two input segments as segment1 and segment2.
Coverage Fraction#
The coverage fraction represents the fraction of segement1 that is covered by segment2. This is measured by projecting segment2 onto segment1.
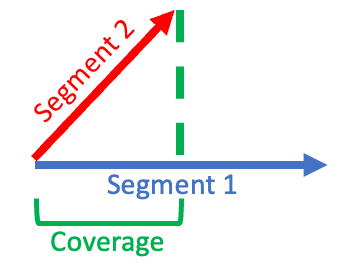
Coverage Distance#
The coverage distance measures how close segement1 is to segment2. This distance is normalized to be between 0 and 1.
A coverage distance of 1 means the actual distance between the segments is 0. As the segments become further and further apart, the coverage distance approaches 0.
An additional input parameter, distance threshold, controls how strict the coverage distance is:
Higher distance threshold = coverage score increases quickly as segments become closer – less strict
Lower distance threshold = coverage score increases less quickly as segments become closer - more strict
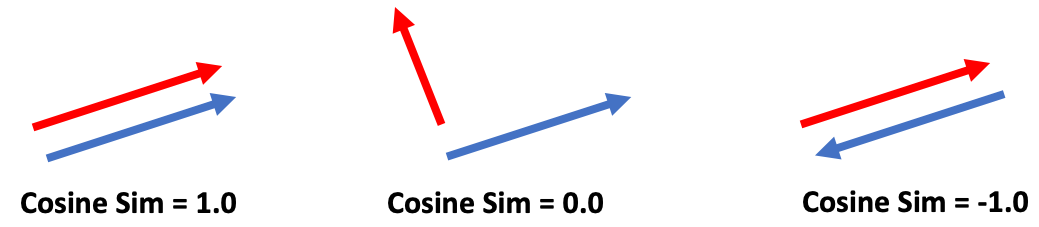
Cosine Similarity#
The cosine similarity measures the similairty between segment1 and segment2 by examining the angle between the two segments. This value is on a -1 to 1 scale with 1 indicating the two segments are pointing in the same direction and -1 indicating the segments pointing in oppposite directions.
Part 2: STCoverage Input Data#
Create the Input Segments#
STCoverage accepts line segments with exactly two points.
Create two segments in the Shape Struct format.
[ ]:
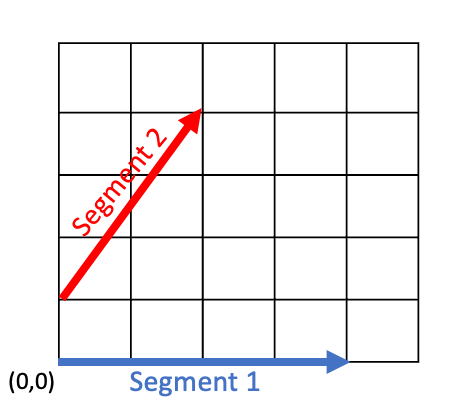
segment1 = "LINESTRING(0 0, 4 0)"
segment2 = "LINESTRING(0 1, 2 4)"

segment_df = spark.sql(f"""
    SELECT
        ST_FromText('{segment1}') AS segment1,
        ST_FromText('{segment2}') AS segment2
    """)

segment_df.show(truncate = False)
+-----------------------------------------------------------------------------------------------------------------------------------------------------------------------------+-----------------------------------------------------------------------------------------------------------------------------------------------------------------------------+
|segment1                                                                                                                                                                     |segment2                                                                                                                                                                     |
+-----------------------------------------------------------------------------------------------------------------------------------------------------------------------------+-----------------------------------------------------------------------------------------------------------------------------------------------------------------------------+
|{[01 05 00 00 00 01 00 00 00 01 02 00 00 00 02 00 00 00 00 00 00 00 00 00 00 00 00 00 00 00 00 00 00 00 00 00 00 00 00 00 10 40 00 00 00 00 00 00 00 00], 0.0, 0.0, 4.0, 0.0}|{[01 05 00 00 00 01 00 00 00 01 02 00 00 00 02 00 00 00 00 00 00 00 00 00 00 00 00 00 00 00 00 00 F0 3F 00 00 00 00 00 00 00 40 00 00 00 00 00 00 10 40], 0.0, 1.0, 2.0, 4.0}|
+-----------------------------------------------------------------------------------------------------------------------------------------------------------------------------+-----------------------------------------------------------------------------------------------------------------------------------------------------------------------------+
Part 3: Using STCoverage#
[ ]:
dist_threshold = 20.0
[ ]:
coverage_df = (
    segment_df.select(
        F.st_coverage('segment1',
                      'segment2',
                      dist_threshold)
        .alias('Coverage')
    )
)
coverage_df.show(truncate=False)
+--------------------------------------------+
|Coverage                                    |
+--------------------------------------------+
|[0.5, 0.802624679775096, 0.5547001962252291]|
+--------------------------------------------+
The first value in the array returned by STCoverage is the coverage fraction followed by the coverage distance and finally the cosine similarity.
The coverage fraction of 0.5 indicates that about half of sgement1 is covered by segment2 when projected
The coverage distance of about 0.8 indicates the two segments are relatively close but not touching
The cosine similarity of about 0.55 indicates that the two segments are about halfway between pointing perpendicular and pointing in the same direction
Adjusting the distance threshold#
Let’s see how lowering the distance threshold makes the coverage distance more strict. In other words, segments have to be closer together to get a better score.
[ ]:
dist_threshold = 10.0
[ ]:
coverage_df = (
    segment_df.select(
        F.st_coverage('segment1',
                      'segment2',
                      dist_threshold)
        .alias('Coverage')
    )
)
coverage_df.show(truncate=False)
+---------------------------------------------+
|Coverage                                     |
+---------------------------------------------+
|[0.5, 0.6200510377447751, 0.5547001962252291]|
+---------------------------------------------+
Now the coverage distance is about 0.62 which is lower than the 0.8 when the threshold was 20.0.
Choosing Distance Threshold#
Distance threshold should be chosen based on the data and the application. Often trial and error is best for selecting this parameter. However, in general, if the segments in the data are further apart, a higher threshold could be chosen to indicate that these far apart sgements are still similar. If the segments in the data are relatively close to each other, then a lower distance threshold could be chosen to be more strict in indicating close together segments.