ST_Densify#
Table of Contents#
[1]:
import bdt
bdt.auth("bdt.lic")
from bdt.functions import *
from pyspark.sql.functions import *
from bdt.processors import *
BDT has been successfully authorized!

            Welcome to
             ___    _                ___         __             ______             __   __     _   __
            / _ )  (_)  ___ _       / _ \ ___ _ / /_ ___ _     /_  __/ ___  ___   / /  / /__  (_) / /_
           / _  | / /  / _ `/      / // // _ `// __// _ `/      / /   / _ \/ _ \ / /  /  '_/ / / / __/
          /____/ /_/   \_, /      /____/ \_,_/ \__/ \_,_/      /_/    \___/\___//_/  /_/\_\ /_/  \__/
                      /___/

BDT python version: v3.5.0-v3.4.0-develop-7-gb089d527
BDT jar version: v3.5.0-v3.4.0-develop-7-gb089d527
Part 1: What is ST_Densify#
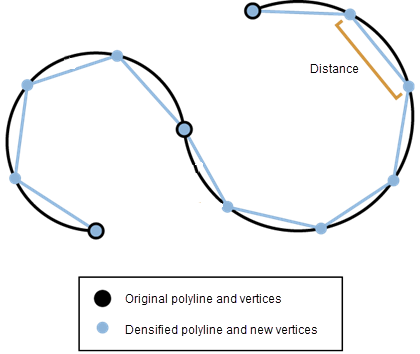
ST_Densify is a function to add additional vertices along a line or polygon geometry. Vertices are added at an interval that does not exceed a specified distance.
If the specified distance is larger than the total length of the geometry, then the distance will default to half the total length of the geometry.
See more details here
Part 2: ST_Densify Input Data#
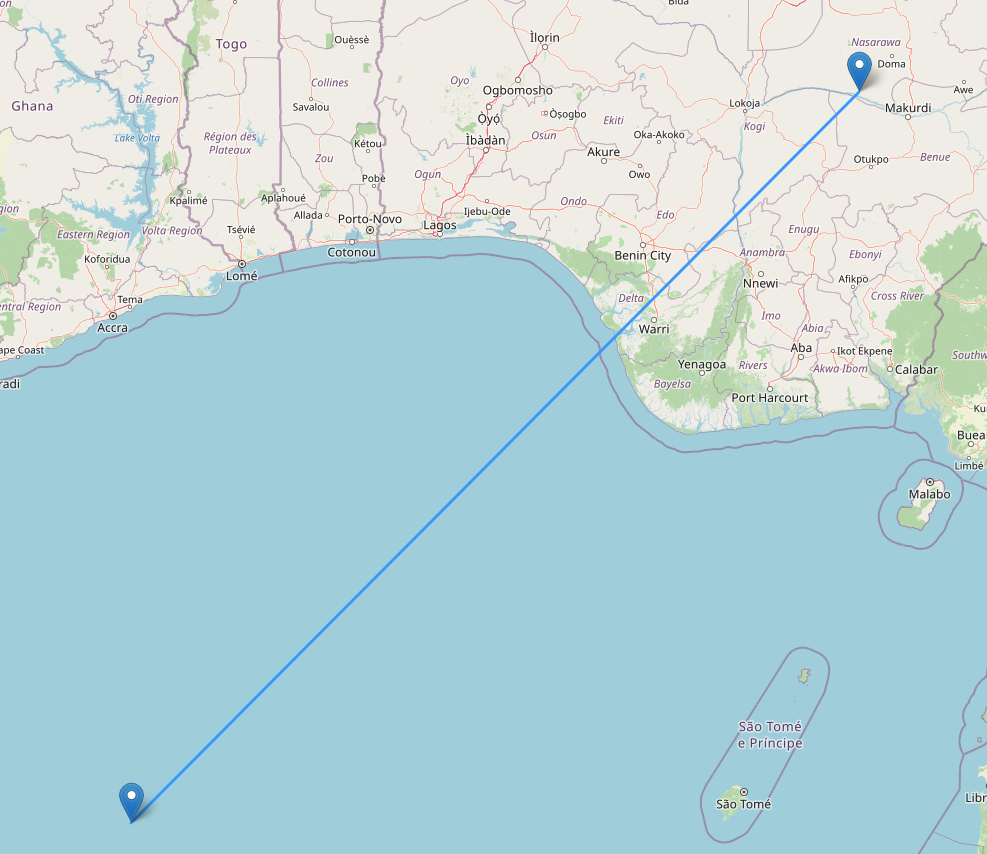
Use Spark to create a sample dataframe containing a polyline
Below is a visualization of the vertices and polyline
[2]:
line_df = spark.createDataFrame([("LINESTRING (0 0, 8 8)",)], ["WKT"])
line_df = line_df.select(st_fromText(col("WKT")).alias("SHAPE"))
line_df.show()
+--------------------+
|               SHAPE|
+--------------------+
|{[01 05 00 00 00 ...|
+--------------------+
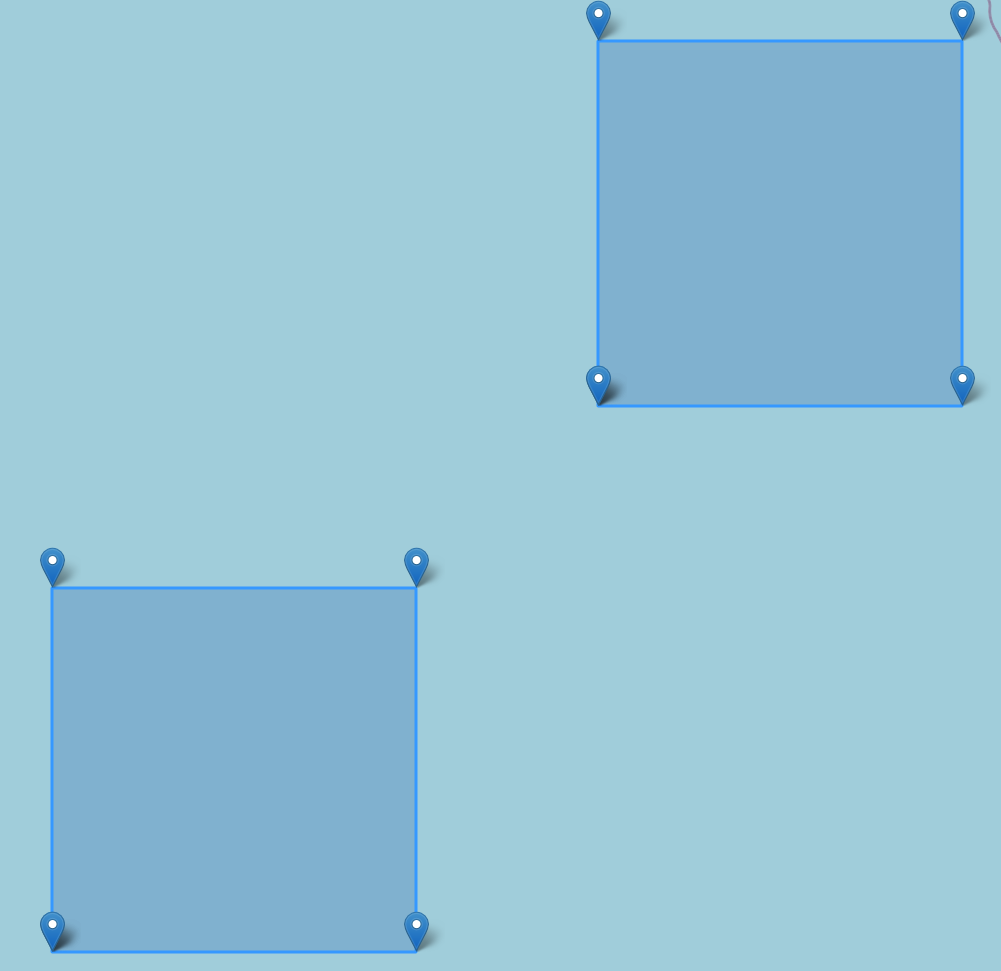
Use Spark to create a sample dataframe containing a polygon
Below is a visualization of the vertices and polygon
[3]:
poly_df = spark.createDataFrame([("MULTIPOLYGON(((0 0, 0 2, 2 2, 2 0, 0 0)), ((3 3, 3 5, 5 5, 5 3, 3 3)))",)], ["WKT"])
poly_df = poly_df.select(st_fromText(col("WKT")).alias("SHAPE"))
poly_df.show()
+--------------------+
|               SHAPE|
+--------------------+
|{[01 06 00 00 00 ...|
+--------------------+
Part 3: Using ST_Densify#
The ST_Densify function requires the following arguments:
struct – The SHAPE struct with wkb, xmin, ymin, xmax, ymax
distance – The maximum distance between vertices to densify by. Can also be a percentage. The distance will be in the units of the input shape struct spatial reference.
isPercent – Boolean flag to set if using a percentage for distance param.
First use the densify function with a small distance of 5.0
[4]:
line_out_df = line_df.select(st_asText(st_densify("SHAPE", 5.0, False)).alias("WKT"))
line_out_df.show(truncate=False)
+--------------------------------------------------------------------------------------------------------+
|WKT                                                                                                     |
+--------------------------------------------------------------------------------------------------------+
|MULTILINESTRING ((0 0, 2.6666666666666665 2.6666666666666665, 5.333333333333333 5.333333333333333, 8 8))|
+--------------------------------------------------------------------------------------------------------+
Use the densify function with a larger distance of 75.0
In this example with the points (0 0, 8 8), using the distance forumla the total length of the geometry should be ~11.313708498985
Since the 75.0 > 11.3, the distance between vertices will default to half the total length of the geometry (11.313708498985 * 0.5)
[5]:
line_out_df = line_df.select(st_asText(st_densify("SHAPE", 75.0, False)).alias("WKT"))
line_out_df.show(truncate=False)
+---------------------------------+
|WKT                              |
+---------------------------------+
|MULTILINESTRING ((0 0, 4 4, 8 8))|
+---------------------------------+
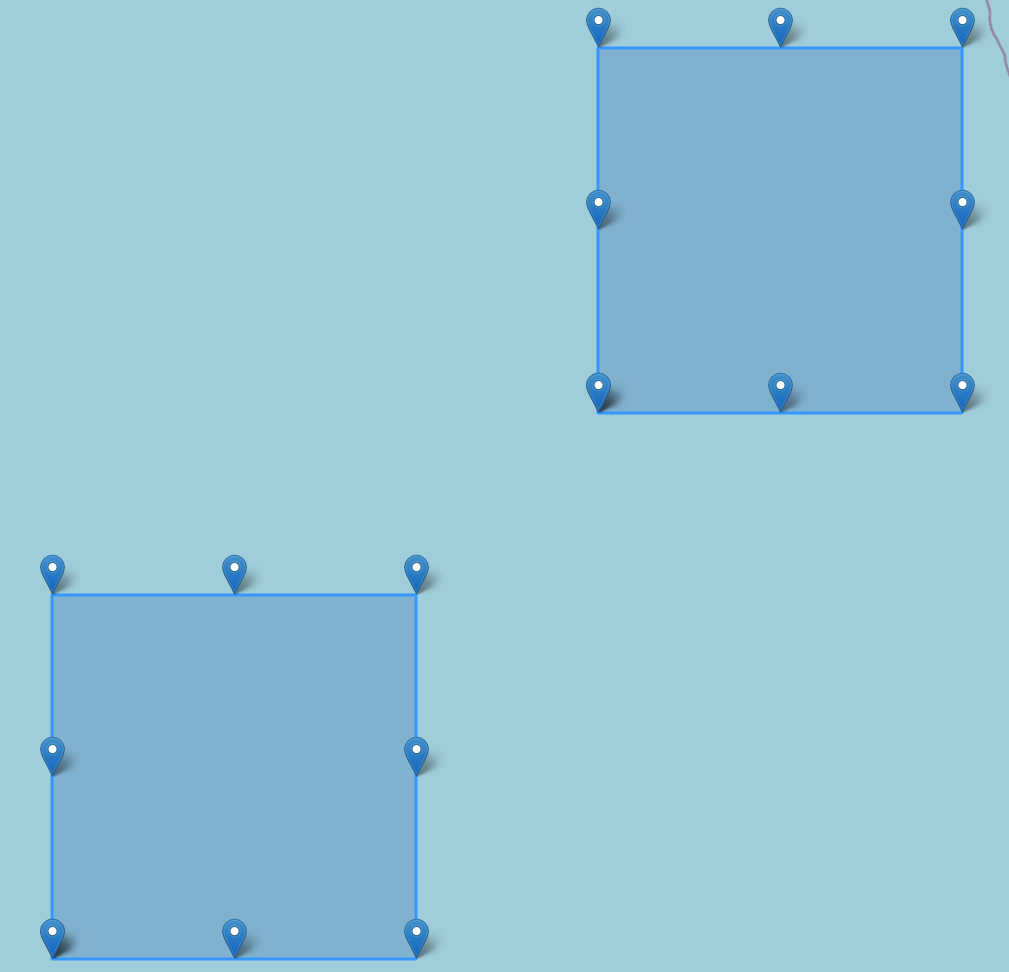
Use the densify function with the polygon df and define a percentage of the total geometry distance
[6]:
poly_out_df = poly_df.select(st_asText(st_densify("SHAPE", 10.0, True)).alias("WKT"))
poly_out_df.show(truncate=False)
+---------------------------------------------------------------------------------------------------------------+
|WKT                                                                                                            |
+---------------------------------------------------------------------------------------------------------------+
|MULTIPOLYGON (((0 0, 1 0, 2 0, 2 1, 2 2, 1 2, 0 2, 0 1, 0 0)), ((3 3, 4 3, 5 3, 5 4, 5 5, 4 5, 3 5, 3 4, 3 3)))|
+---------------------------------------------------------------------------------------------------------------+
