ST_SnapToStreet#
ST_SnapToStreet requires an additional, seperate license for street map premium data. Please contact the BDT team at bdt_support@esri.com if you are interested.
Table of Contents#
[ ]:
import bdt
bdt.auth("bdt.lic")
from bdt.functions import *
from pyspark.sql.functions import *
from pyspark.sql.types import *
import geopandas
import folium
import mapclassify
import matplotlib
BDT has been successfully authorized!

            Welcome to
             ___    _                ___         __             ______             __   __     _   __
            / _ )  (_)  ___ _       / _ \ ___ _ / /_ ___ _     /_  __/ ___  ___   / /  / /__  (_) / /_
           / _  | / /  / _ `/      / // // _ `// __// _ `/      / /   / _ \/ _ \ / /  /  '_/ / / / __/
          /____/ /_/   \_, /      /____/ \_,_/ \__/ \_,_/      /_/    \___/\___//_/  /_/\_\ /_/  \__/
                      /___/

BDT python version: v3.5.0-v3.5.0
BDT jar version: v3.5.0-v3.5.0
Part 1: What is ST_SnapToStreet#
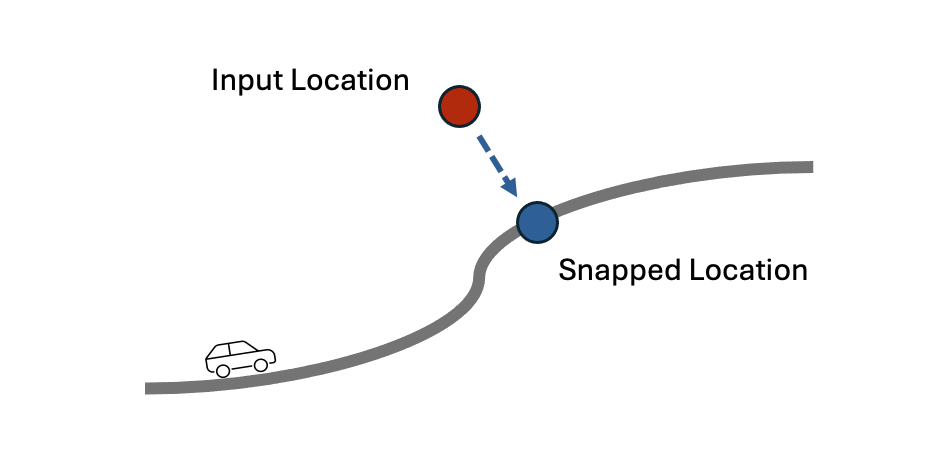
ST_SnapToStreet snaps an x and y coordinate in spatial reference 3857 to its closest street within 500 meters.
“Snapping” means finding the closest point on the closest street to the input point. The closest point on the street is the “snapped” point for that input point.
If a street is NOT found within 500 meters, then null is returned.
The x and y coordinate of the snapped point and additional attributes about the street are returned.
Part 2: ST_SnapToStreet Input Data#
Sample data with two points, both in spatial reference 3857.
Point with ID 1 is near a highway, and point with ID 2 is near a city street.
[ ]:
points_schema = StructType([StructField("ID", IntegerType()),
                            StructField("X", DoubleType()),
                            StructField("Y", DoubleType())])

points_data = [(1, -13041591.029533, 3859473.958446),
(2, -13042219.843524, 3859630.415489)]

points_df = spark.createDataFrame(data = points_data, schema = points_schema)

points_df.show(2)
+---+------------------+--------------+
| ID|                 X|             Y|
+---+------------------+--------------+
|  1|-1.3041591029533E7|3859473.958446|
|  2|-1.3042219843524E7|3859630.415489|
+---+------------------+--------------+
Visualize the input points using Geopandas and Folium The Esri.WorldStreetMap base map is specified to visualize the streets alongside the input points.
[ ]:
def explore_example(points):

    points_wkb = points.select(st_makePoint("X", "Y").WKB.alias("WKB"))
    points_pdf = points_wkb.toPandas()
    points_geom = geopandas.GeoSeries.from_wkb(b""+points_pdf["WKB"], crs=f"EPSG:{3857}")
    points_gdf = geopandas.GeoDataFrame(points_pdf, geometry=points_geom).drop(["WKB"], axis=1)

    m = points_gdf.explore(legend=False, color="red", tiles="Esri.WorldStreetMap")
    folium.LayerControl().add_to(m)
    return m
[ ]:
explore_example(points_df)
Part 3: Using ST_SnapToStreet#
ST_SnapToStreet will return a struct with the following values:
SNAP_X
SNAP_Y
KPH
PUBLIC_ACCESS
LIMITED_ACCESS
RESTRICT_CARS
PAVED
FUNC_CL
HIERARCHY
ROAD_CL
[ ]:
snapped_points_df = (
    points_df
        .select(st_snap_to_street("X", "Y").alias("SNAP_RESULT"))
)

snapped_points_df.printSchema()
snapped_points_df.show(truncate=False)
root
 |-- SNAP_RESULT: struct (nullable = true)
 |    |-- SNAP_X: double (nullable = true)
 |    |-- SNAP_Y: double (nullable = true)
 |    |-- KPH: integer (nullable = true)
 |    |-- PUBLIC_ROAD: boolean (nullable = true)
 |    |-- CONTROLLED_ACCESS: boolean (nullable = true)
 |    |-- PAVED: boolean (nullable = true)
 |    |-- FUNC_CL: integer (nullable = true)
 |    |-- ROAD_CL: integer (nullable = true)
 |    |-- HIERARCHY: integer (nullable = true)

+---------------------------------------------------------------------------+
|SNAP_RESULT                                                                |
+---------------------------------------------------------------------------+
|{-1.3041596848023308E7, 3859476.1825415143, 74, true, true, true, 20, 2, 2}|
|{-1.3042224502474036E7, 3859630.325720133, 32, true, false, true, 52, 1, 4}|
+---------------------------------------------------------------------------+
The below code unpacks the values of the struct into their own columns.
[ ]:
snapped_points_df2 = (
    snapped_points_df
        .select(inline(array(col("SNAP_RESULT"))))
)

snapped_points_df2.show()
+--------------------+------------------+---+-----------+-----------------+-----+-------+-------+---------+
|              SNAP_X|            SNAP_Y|KPH|PUBLIC_ROAD|CONTROLLED_ACCESS|PAVED|FUNC_CL|ROAD_CL|HIERARCHY|
+--------------------+------------------+---+-----------+-----------------+-----+-------+-------+---------+
|-1.30415968480233...|3859476.1825415143| 74|       true|             true| true|     20|      2|        2|
|-1.30422245024740...| 3859630.325720133| 32|       true|            false| true|     52|      1|        4|
+--------------------+------------------+---+-----------+-----------------+-----+-------+-------+---------+
The inline(array(…)) syntax can be directly called on the function result to combine the two above cells into one.
[ ]:
snapped_points_df3 = (
    points_df
        .select(inline(array(st_snap_to_street("X", "Y"))))
)

snapped_points_df3.show()
+--------------------+------------------+---+-----------+-----------------+-----+-------+-------+---------+
|              SNAP_X|            SNAP_Y|KPH|PUBLIC_ROAD|CONTROLLED_ACCESS|PAVED|FUNC_CL|ROAD_CL|HIERARCHY|
+--------------------+------------------+---+-----------+-----------------+-----+-------+-------+---------+
|-1.30415968480233...|3859476.1825415143| 74|       true|             true| true|     20|      2|        2|
|-1.30422245024740...| 3859630.325720133| 32|       true|            false| true|     52|      1|        4|
+--------------------+------------------+---+-----------+-----------------+-----+-------+-------+---------+
Point with ID 1 snapped to a highway, so its KPH average is higher and it’s classified as level 2 in ROAD_CL.
Point with ID 2 snapped to a city street, so its KPH average is lower and it’s classified as level 1 in ROAD_CL.
For more information on what each attribute means:
Navigate to the release notes for File geodatabase (.gdb) and download the zipfile.
Unzip the release notes. Open help.htm in a web browser. In the dropdown, navigate to Data Dictionary -> Line layers -> Streets.
[ ]:
def explore_result(input_points, snapped_points):

    input_points_wkb = input_points.select(st_makePoint("X", "Y").WKB.alias("WKB"))
    input_points_pdf = input_points_wkb.toPandas()
    input_points_geom = geopandas.GeoSeries.from_wkb(b""+input_points_pdf["WKB"], crs=f"EPSG:{3857}")
    input_points_gdf = geopandas.GeoDataFrame(input_points_pdf, geometry=input_points_geom).drop(["WKB"], axis=1)

    snapped_points_wkb = snapped_points.select(st_makePoint("SNAP_X", "SNAP_Y").WKB.alias("WKB"))
    snapped_points_pdf = snapped_points_wkb.toPandas()
    snapped_points_geom = geopandas.GeoSeries.from_wkb(b""+snapped_points_pdf["WKB"], crs=f"EPSG:{3857}")
    snapped_points_gdf = geopandas.GeoDataFrame(snapped_points_pdf, geometry=snapped_points_geom).drop(["WKB"], axis=1)

    m = input_points_gdf.explore(legend=False, color="red", tiles="Esri.WorldStreetMap")
    m = snapped_points_gdf.explore(legend=False, color="blue", m=m)
    folium.LayerControl().add_to(m)
    return m
Here are the input points in red alongside their snapped points in blue.
[ ]:
explore_result(points_df, snapped_points_df3)