Processor RasterExtract#
Table of Contents#
Part 1: What is Processor Nodes#
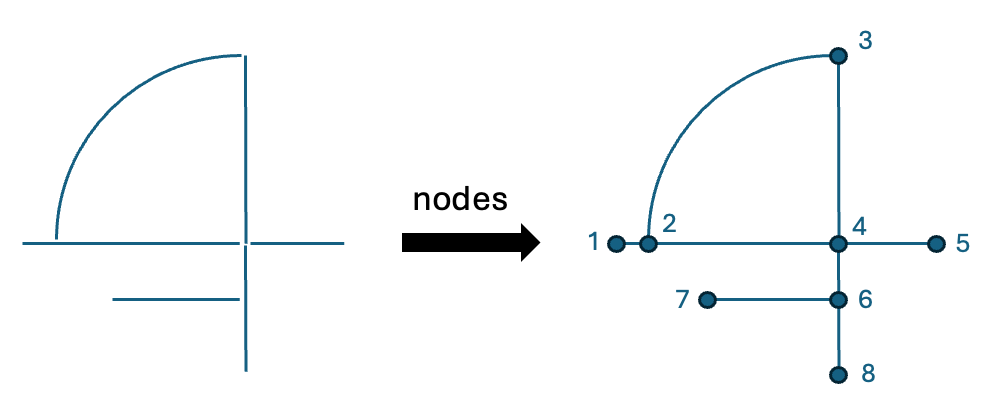
nodesis a processor that creates unique nodes from a collection of polylines typically representing a network.This processor will return a dataframe with 3 columns:
nid: A unique node ID for each node.
x: The x coordinate of the node.
y: The y coordinate of the node.

It is important to note that this processor does not modify the line geometries in any way. In the example above, node 6 does not split the line between node 4 and node 8. And, node 4 does not connect the four lines leading into it.
Tolerance#
The
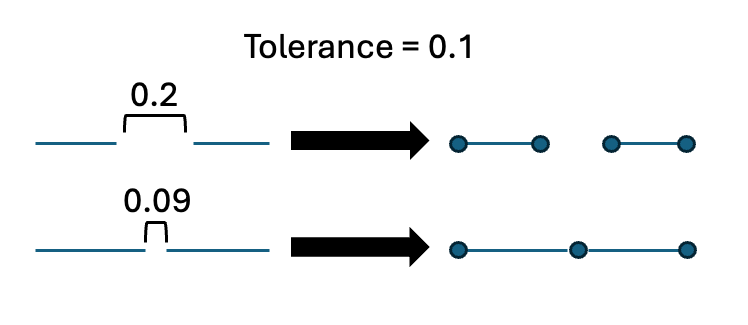
nodesprocessor takes a tolerance parameter. This parameter controls the minimum distance between line end points before they are considered a single node. It is in units of the spatial reference of the polylines.

A good tolerance to start with for a network in 3857 spatial reference is 0.1 meters. Or 0.0001 degrees in 4326.
If the road network is messy, with gaps between roads that should connect in the network, set this tolerance higher.
If the road network is organized and precise, set this tolerance lower.
In general, it may take some trial and error with tolerance to narrow down the best value for the specific use case. Visualization in ArcGIS Pro or GeoPandas is helpful in this process.
Part 2: Processor Nodes Example#
Setup BDT#
[1]:
import bdt
bdt.auth("../bdt.lic")
from bdt import processors as P
BDT has been successfully authorized!

            Welcome to
             ___    _                ___         __             ______             __   __     _   __
            / _ )  (_)  ___ _       / _ \ ___ _ / /_ ___ _     /_  __/ ___  ___   / /  / /__  (_) / /_
           / _  | / /  / _ `/      / // // _ `// __// _ `/      / /   / _ \/ _ \ / /  /  '_/ / / / __/
          /____/ /_/   \_, /      /____/ \_,_/ \__/ \_,_/      /_/    \___/\___//_/  /_/\_\ /_/  \__/
                      /___/

BDT python version: v3.5.0-v3.4.0-develop-12-g29dc0e6f
BDT jar version: v3.5.0-v3.4.0-develop-12-g29dc0e6f
Input Data#
Create a DataFrame of Polyline geometries to represent a sample line network. Ensure the DataFrame has geometry metadata.
[3]:
line_df = (
    spark.createDataFrame([
      (1, "LINESTRING(-13046161.218405 4036380.294441, -13046167.190047 4036758.005516)"),
      (2, "LINESTRING(-13046167.190047 4036758.005516, -13046649.698789 4036761.285254)"),
      (3, "LINESTRING(-13046649.698789 4036761.285254, -13046647.310131 4036266.833227)"),
      (4, "LINESTRING(-13046649.698789 4036761.285254, -13047139.070253 4036758.005516)"),
      (5, "LINESTRING(-13046649.698789 4036761.285254, -13046657.447928 4036957.458386)"),
    ], schema="ID int, WKT string")
        .selectExpr("ID", "ST_FromText(WKT) AS SHAPE")
        .withMeta("Polyline", 3857)
)
[8]:
line_df.show()
+---+--------------------+
| ID|               SHAPE|
+---+--------------------+
|  1|{[01 05 00 00 00 ...|
|  2|{[01 05 00 00 00 ...|
|  3|{[01 05 00 00 00 ...|
|  4|{[01 05 00 00 00 ...|
|  5|{[01 05 00 00 00 ...|
+---+--------------------+
Use GeoPandas to visualize the line network
[5]:
import xyzservices.providers as xyz
line_df.to_geo_pandas(3857).explore(tiles=xyz.Esri.WorldStreetMap,
                                    color=["red", "purple", "blue", "green", "black"],
                                    style_kwds={"weight":3})
[5]:
Running Processor Nodes#
Now, run the
nodesprocessor using the sample line dataset above.The line network is relatively precise with the ends of lines touching each other, so a small tolerance is chosen.
[6]:
node_df = P.nodes(line_df, 0.1)
node_df.show()
+---+--------------+----------+
|nid|             x|         y|
+---+--------------+----------+
|  0|-1.304616715E7|4036758.05|
|  1|-1.304616125E7|4036380.25|
|  2|-1.304664965E7|4036761.25|
|  3|-1.304664735E7|4036266.85|
|  4|-1.304713905E7|4036758.05|
|  5|-1.304665745E7|4036957.45|
+---+--------------+----------+
Visualize the created nodes on top of the line network
[9]:
P.to_geo_pandas_layers([line_df, node_df.selectExpr("nid", "ST_MakePoint(x, y) SHAPE")],
                       3857,
                       ["lines", "nodes"])
[9]: