Zonal Statistics#
Table of Contents#
Part 1: What is Processor ZonalStatistics#
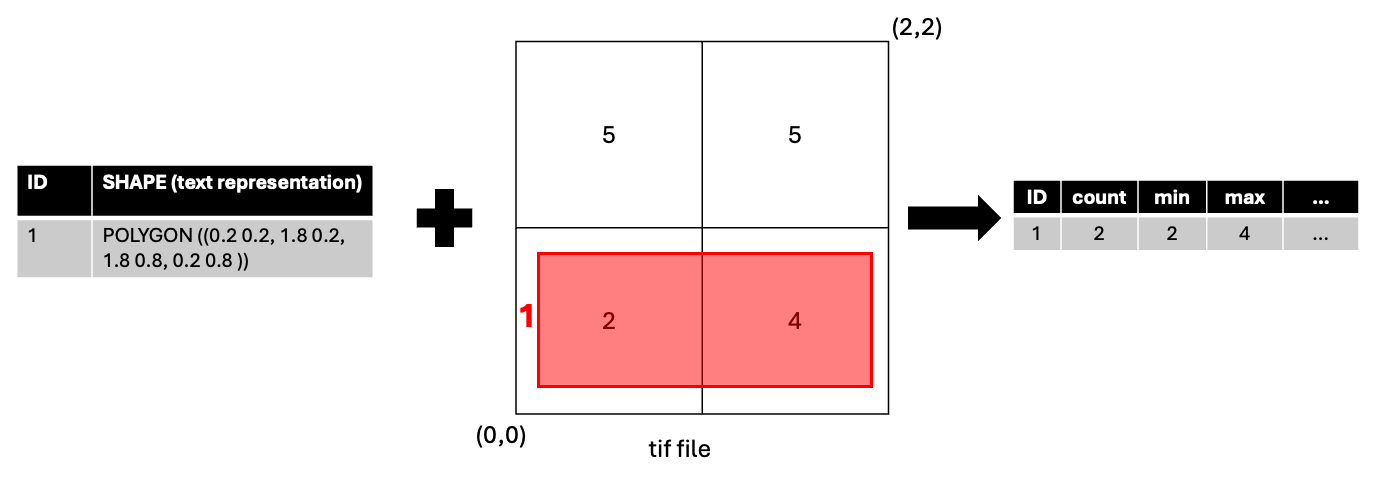
ZonalStatistics is a processor that calculates statistics on the values of the raster cells a given polygon overlaps.
Part 2: Processor ZonalStatistics Example#
Setup BDT#
[ ]:
import pyspark
import bdt
bdt.auth("bdt.lic")
from bdt import functions as B
from bdt import processors as P
BDT has been successfully authorized!

            Welcome to
             ___    _                ___         __             ______             __   __     _   __
            / _ )  (_)  ___ _       / _ \ ___ _ / /_ ___ _     /_  __/ ___  ___   / /  / /__  (_) / /_
           / _  | / /  / _ `/      / // // _ `// __// _ `/      / /   / _ \/ _ \ / /  /  '_/ / / / __/
          /____/ /_/   \_, /      /____/ \_,_/ \__/ \_,_/      /_/    \___/\___//_/  /_/\_\ /_/  \__/
                      /___/

BDT python version: v3.5.0-v3.5.0
BDT jar version: v3.5.0-v3.5.0
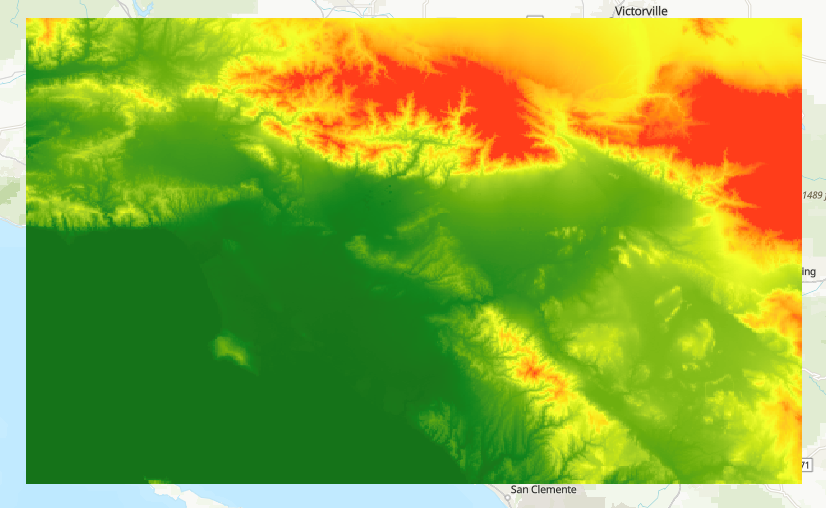
Input Raster#
Elevation data from the U.S. Geological Survey and the National Geospatial-Intelligence Agency
Available on ArcGIS Living Atlas
Cut down to the LA area as a sample
[ ]:
raster_file = "./data/World_Elevation_GMTE_LA.tif"
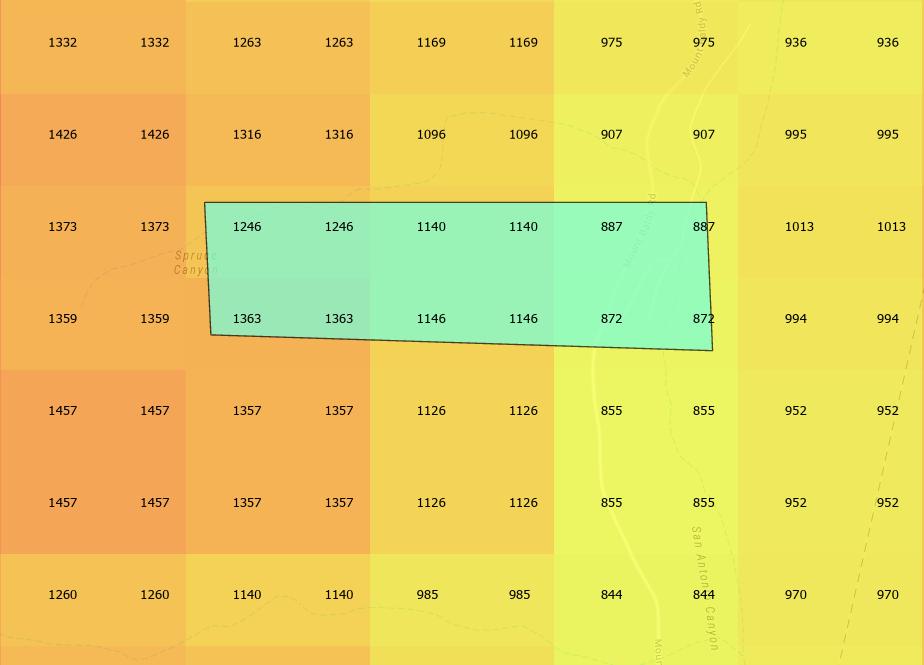
Input Data#
Create a sample polygon that overlaps some raster cells from the
World_Elevation_GMTE_LA.tif.Assign it a unique ID,
PARCEL_IDin this example.
[ ]:
polygon = """
        POLYGON((
        -117.6878845 34.1968949,
        -117.6756497 34.1968949,
        -117.6754958 34.1939036,
        -117.6877306 34.1942218
        ))
        """

# The raster uses spatial reference 3857 so the polygon must be projected to it.
polygon_df = spark.sql(f"""
                        SELECT
                            ST_Project(ST_FromText('{polygon}'), 4326, 3857) AS SHAPE,
                            '1' AS PARCEL_ID
                        """).withMeta("POLYGON", 3857)
Running Processor ZonalStatistics#
Calculate elevation statistics for the polygon.
Parameters:#
Polygon DataFrame
Path to raster TIF file
Unique ID field for the polygon DataFrame
mode: Set to “area” (any overlap) or “cell” (centroid overlap)
“area” mode considers all raster cells that overlap the polygon. When using this mode, also use the deno parameter.
“cell” mode only considers raster cells whose centroid overlaps the polygon.
Note: when using area mode, all raster cell values that overlap are weighted by the proportion of overlap with the polygon BEFORE calculating any statistics. To only use the proportion overlap weights on the mean as a weighted mean, but keep the rest of the statistics using the raw raster values see zonal_statistics_weighted_mean.
[ ]:
output_df = P.zonal_statistics_table(polygon_df,
                                     raster_file,
                                     miid_field="PARCEL_ID",
                                     mode="cell")
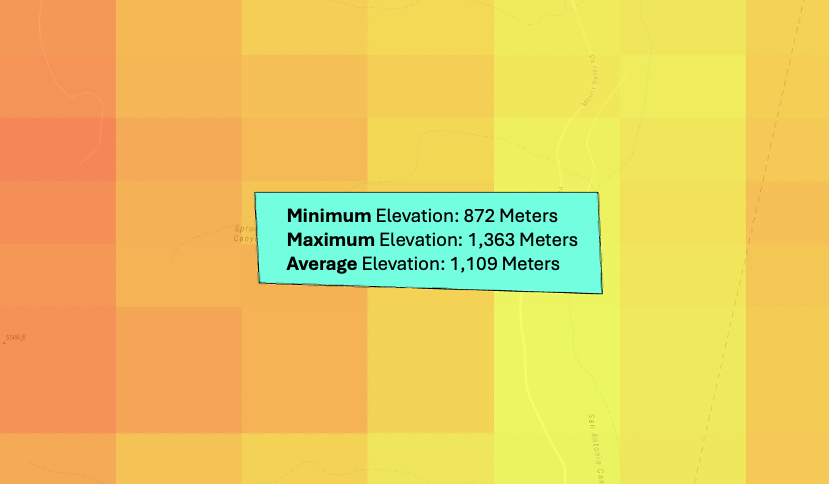
Output statistics:#
Count
Min
Max
Area of the overlapping region with the polygon
Mean
Standard deviation
Sum
50th percentile
90th percentile
[ ]:
output_df.show(truncate=False)
+---------+-----+-----+------+--------+------+------------------+-------+------+------+
|PARCEL_ID|count|min  |max   |area    |mean  |std               |sum    |pct50 |pct90 |
+---------+-----+-----+------+--------+------+------------------+-------+------+------+
|1        |12   |872.0|1363.0|750000.0|1109.0|178.45074016844723|13308.0|1143.0|1363.0|
+---------+-----+-----+------+--------+------+------------------+-------+------+------+
The resulting dataframe can be joined back to the original dataframe to enrich the polygon geometries with the raster cell statistics.
[ ]:
output_df.join(polygon_df, "PARCEL_ID").show()
+---------+-----+-----+------+--------+------+------------------+-------+------+------+--------------------+
|PARCEL_ID|count|  min|   max|    area|  mean|               std|    sum| pct50| pct90|               SHAPE|
+---------+-----+-----+------+--------+------+------------------+-------+------+------+--------------------+
|        1|   12|872.0|1363.0|750000.0|1109.0|178.45074016844723|13308.0|1143.0|1363.0|{[01 06 00 00 00 ...|
+---------+-----+-----+------+--------+------+------------------+-------+------+------+--------------------+
Error Checking#
If an error occurs during the processing of any input polygon, the values of the output statistics for polygons that error will be null as such:
+----+-----+----+----+----+-----+----+----+-----+-----+
|miid|count| min| max|area|wmean| std| sum|pct50|pct90|
+----+-----+----+----+----+-----+----+----+-----+-----+
|   1| NULL|NULL|NULL|NULL| NULL|NULL|NULL| NULL| NULL|
+----+-----+----+----+----+-----+----+----+-----+-----+
To check if any polygons produced an error during processing, check if one of the output statistics are null:
[ ]:
output_df.where("count is null").show()
+---------+-----+---+---+----+----+---+---+-----+-----+
|PARCEL_ID|count|min|max|area|mean|std|sum|pct50|pct90|
+---------+-----+---+---+----+----+---+---+-----+-----+
+---------+-----+---+---+----+----+---+---+-----+-----+
Note that none of these statistics will be null unless an error occurred. For more details about what caused the error, see the logs of the spark workers after running the processor. In databricks, this is the log4j output.