Processor VectorToRaster#
Table of Contents#
Part 1: What is Processor VectorToRaster#
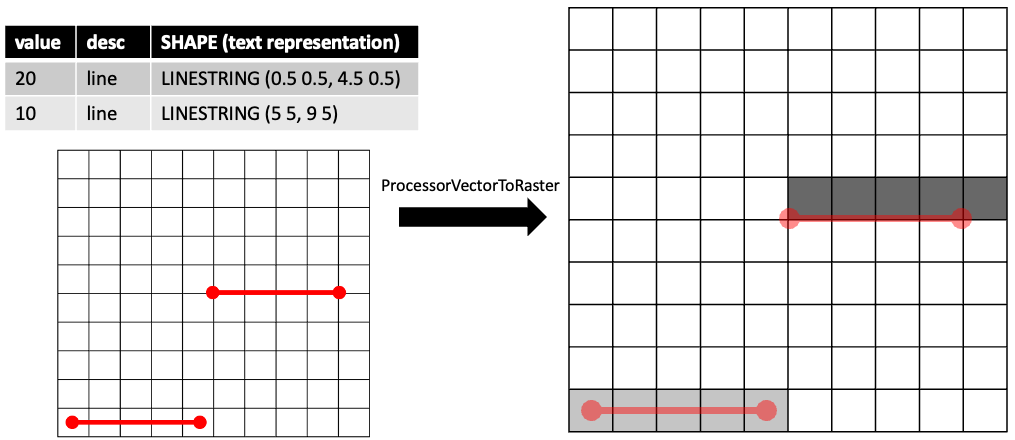
VectorToRaster is a processor that converts a DataFrame with vector data into raster tiff form.
Input#
Processor VectorToRaster takes a dataframe with the following schema:
root
|-- value: float (nullable = false)
|-- desc: string (nullable = true)
|-- SHAPE: struct (nullable = true)
|    |-- WKB: binary (nullable = true)
|    |-- XMIN: double (nullable = true)
|    |-- YMIN: double (nullable = true)
|    |-- XMAX: double (nullable = true)
|    |-- YMAX: double (nullable = true)
Where
SHAPErepresents the vector geometry to rasterize.valuerepresents the value assigned to the raster cells the geometry is turned into.descis a string description or category assigned to the vector.
Partitioning#
In VectorToRaster, the input geometry vectors are partitioned and converted into separate tiff files to improve efficiency. There are two values that work together in determining the partitions:
The
descof the geometry
A string description or category associated with the geometry
The
cell_sizeparameter
The cell size in world units to spatially partition the geometries into QRs by.
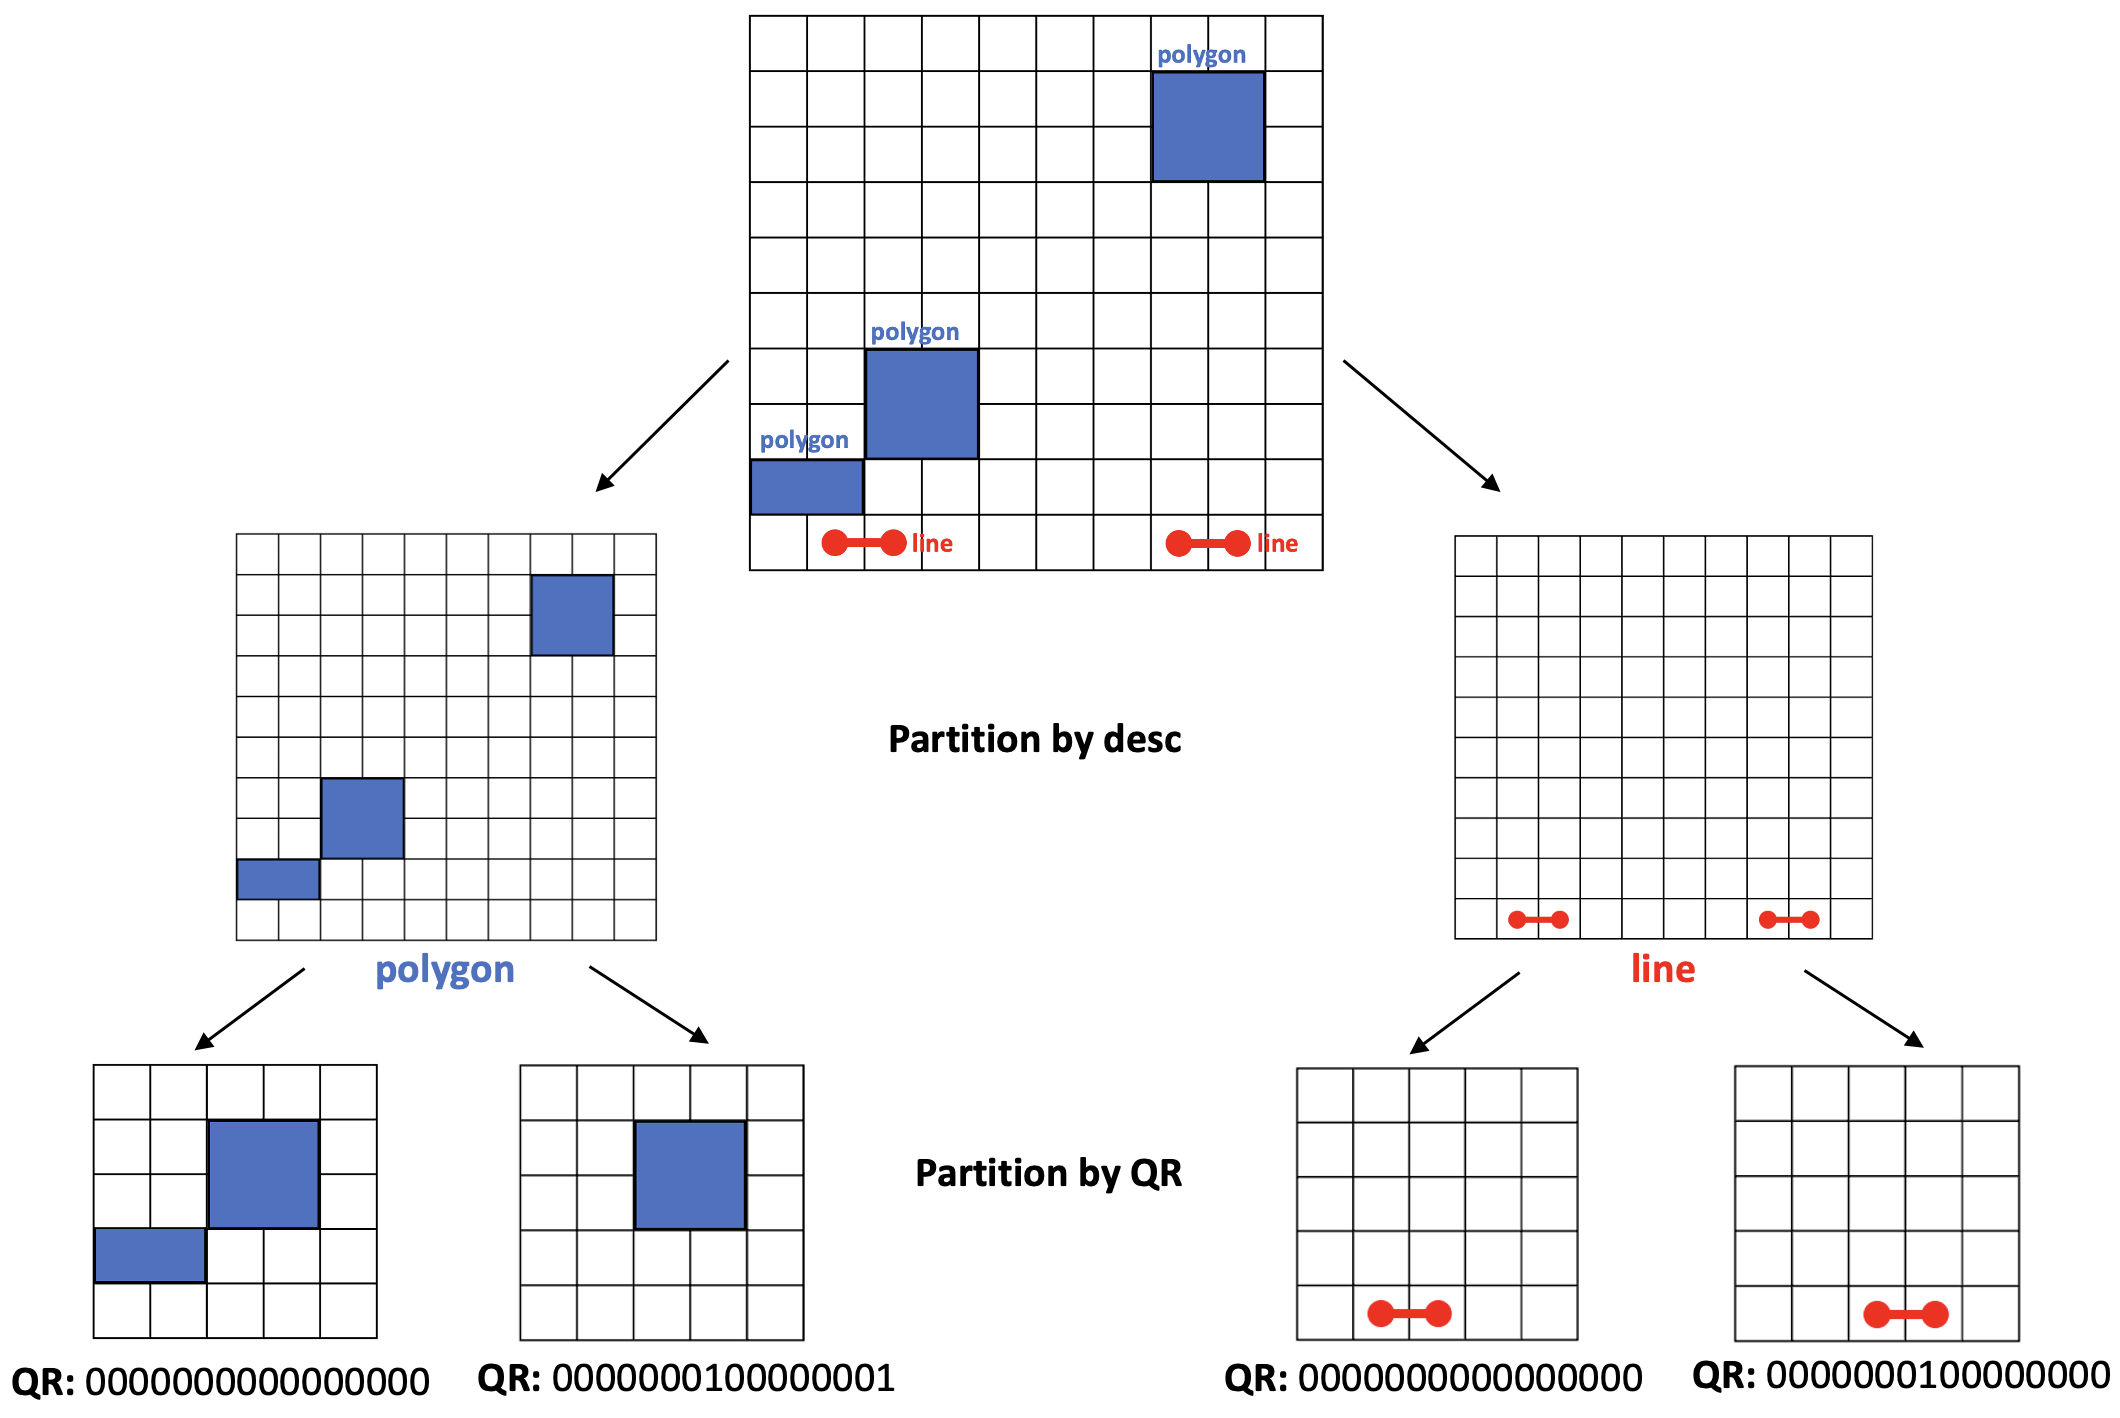
Partitions are formed by unique QR and description pairs. It can be thought of as first partitioning the geometries by
descinto groups of geometries with the samedescand then spatially partitioning each of those groups by QR. Each of those QR groups is written to a separate tiff file.
Raster Cell Size#
Two parameters control the size of each raster cell in the output tiff:
cell_size
The cell size in world units to spatially partition. This is also the world dimension of each tiff.
image_dim
The pixel dimension (width and height) of each partition’s tiff file.
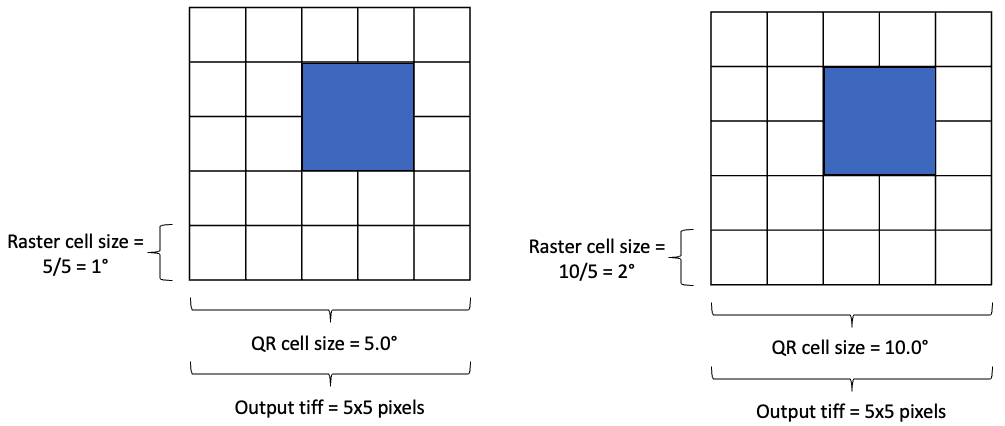
VectorToRaster will attempt to fit the world dimensions of the raster defined by
cell_sizeinto the number of pixels defined byimage_dim.This means that raster cell size =
cell_size/image_dimEX: We want the raster to cover 10 real world degrees but the image dimension to only be 5 pixels wide and tall. So cell_size = 10, image_dim = 5, thus each raster cell must be 2 degrees (10 / 5 = 2).
EX: We want the raster to cover 5 real world degrees but the image dimension to only be 5 pixels wide and tall. So cell_size = 5, image_dim = 5, thus each raster cell must be 1 degrees (5 / 5 = 1).
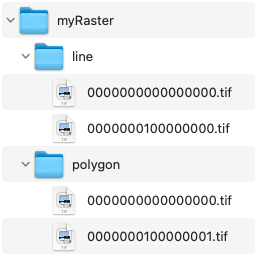
File Structure#
The file path passed to the output_path parameter will be the root directory of the saved tiff files.
Each unique desc will get its own subfolder under the root.
Each of the desc folders will contain the tiff files for each QR partition of the geometries with that desc. - tiff files will be named by the QR partition they represent. - The tiff files can be stitched together afterward using a tool like Mosaic in ArsGIS Pro.
Part 2: Processor VectorToRaster Example#
Setup BDT#
[ ]:
import bdt
bdt.auth("bdt.lic")
from bdt import processors as P
BDT has been successfully authorized!

            Welcome to
             ___    _                ___         __             ______             __   __     _   __
            / _ )  (_)  ___ _       / _ \ ___ _ / /_ ___ _     /_  __/ ___  ___   / /  / /__  (_) / /_
           / _  | / /  / _ `/      / // // _ `// __// _ `/      / /   / _ \/ _ \ / /  /  '_/ / / / __/
          /____/ /_/   \_, /      /____/ \_,_/ \__/ \_,_/      /_/    \___/\___//_/  /_/\_\ /_/  \__/
                      /___/

BDT python version: v3.5.0-v3.5.0
BDT jar version: v3.5.0-v3.5.0
Input Data#
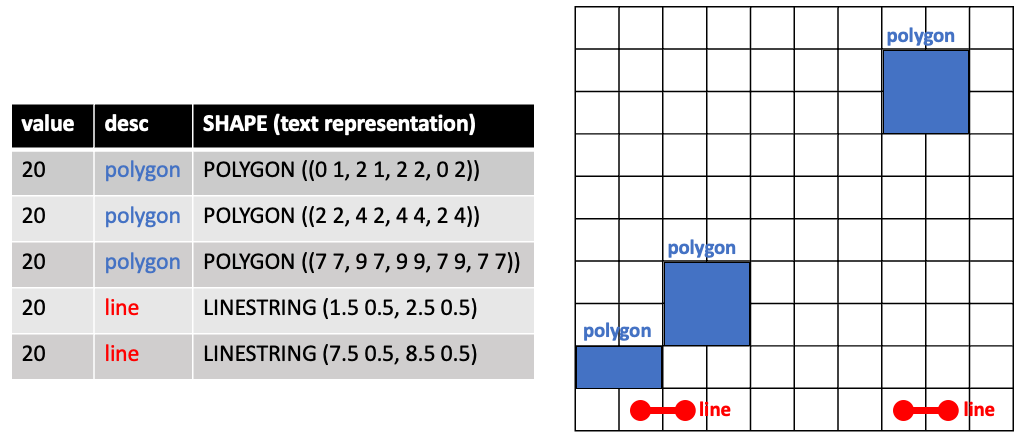
Create a DataFrame of geometries with descs and values for each geometry.
[ ]:
df = spark.createDataFrame([
  (20.0, "polygon", "POLYGON ((0 1, 2 1, 2 2, 0 2))"),
  (20.0, "polygon", "POLYGON ((2 2, 4 2, 4 4, 2 4))"),
  (20.0, "polygon", "POLYGON ((7 7, 9 7, 9 9, 7 9, 7 7))"),
  (20.0, "line", "LINESTRING (1.5 0.5, 2.5 0.5)"),
  (20.0, "line", "LINESTRING (7.5 0.5, 8.5 0.5)")
], schema="value float, desc string, WKT string") \
    .selectExpr("value", "desc", "ST_FromText(WKT) AS SHAPE")
[ ]:
df.show()
+-----+-------+--------------------+
|value|   desc|               SHAPE|
+-----+-------+--------------------+
| 20.0|polygon|{[01 06 00 00 00 ...|
| 20.0|polygon|{[01 06 00 00 00 ...|
| 20.0|polygon|{[01 06 00 00 00 ...|
| 20.0|   line|{[01 05 00 00 00 ...|
| 20.0|   line|{[01 05 00 00 00 ...|
+-----+-------+--------------------+
Running Processor VectorToRaster#
Let’s run Processor VectorToRaster using the same sample data pictured above.
[ ]:
outDF = P.vector_to_raster(df, "file:///C://myRaster", cell_size=5.0, image_dim=5)
[ ]:
outDF.show(truncate=False)
+-------------------------------------------------+----+----+
|path                                             |xmin|ymin|
+-------------------------------------------------+----+----+
|file:///C://myRaster/polygon/0000000000000000.tif|0.0 |0.0 |
|file:///C://myRaster/polygon/0000000100000001.tif|5.0 |5.0 |
|file:///C://myRaster/line/0000000100000000.tif   |5.0 |0.0 |
|file:///C://myRaster/line/0000000000000000.tif   |0.0 |0.0 |
+-------------------------------------------------+----+----+
The output DataFrame of VectorToRaster contains a column with the file path of each saved raster along with the x and y min of the QR partition each raster represents.
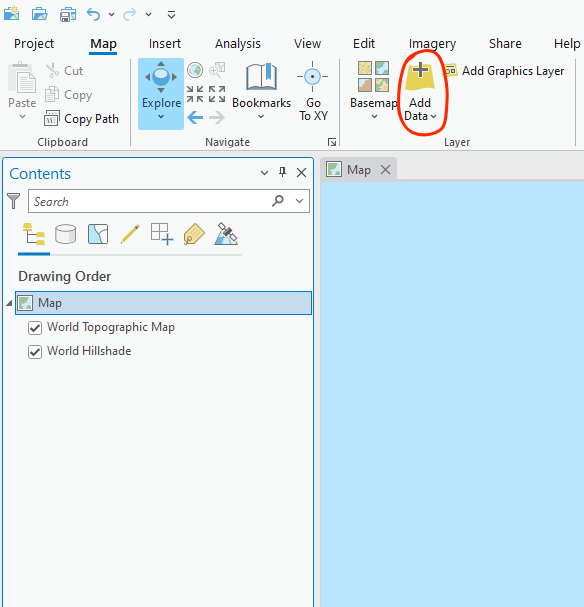
Part 3: Bringing the Rasters into AcrGIS Pro#
In Pro, select the Map tab and then Add Data.
Select data then navigate to the folder where your tif is stored and select it. Pro may prompt to calculate statistics, this can be done optionally.
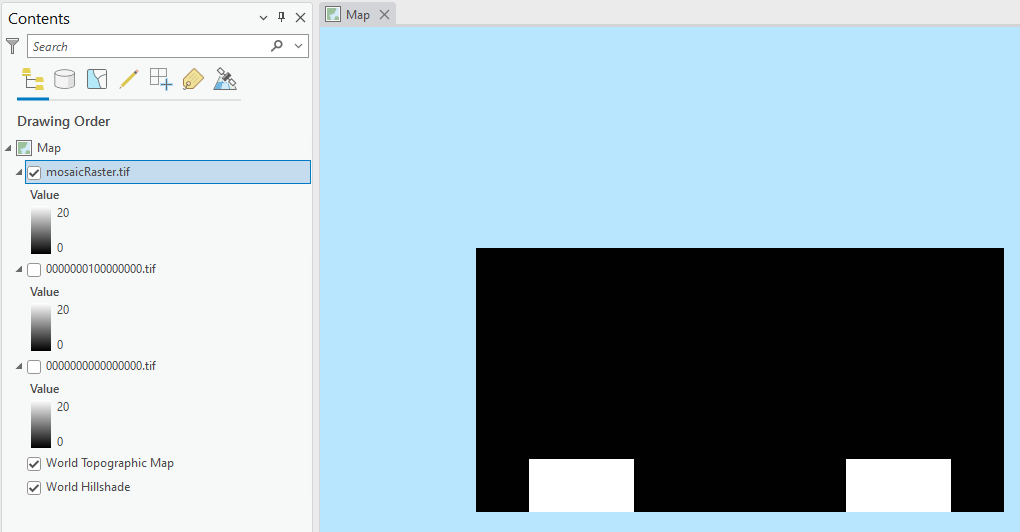
Now the tif file should be listed in the Contents pane
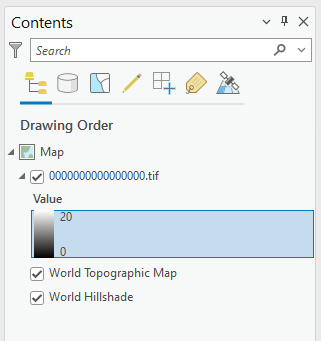
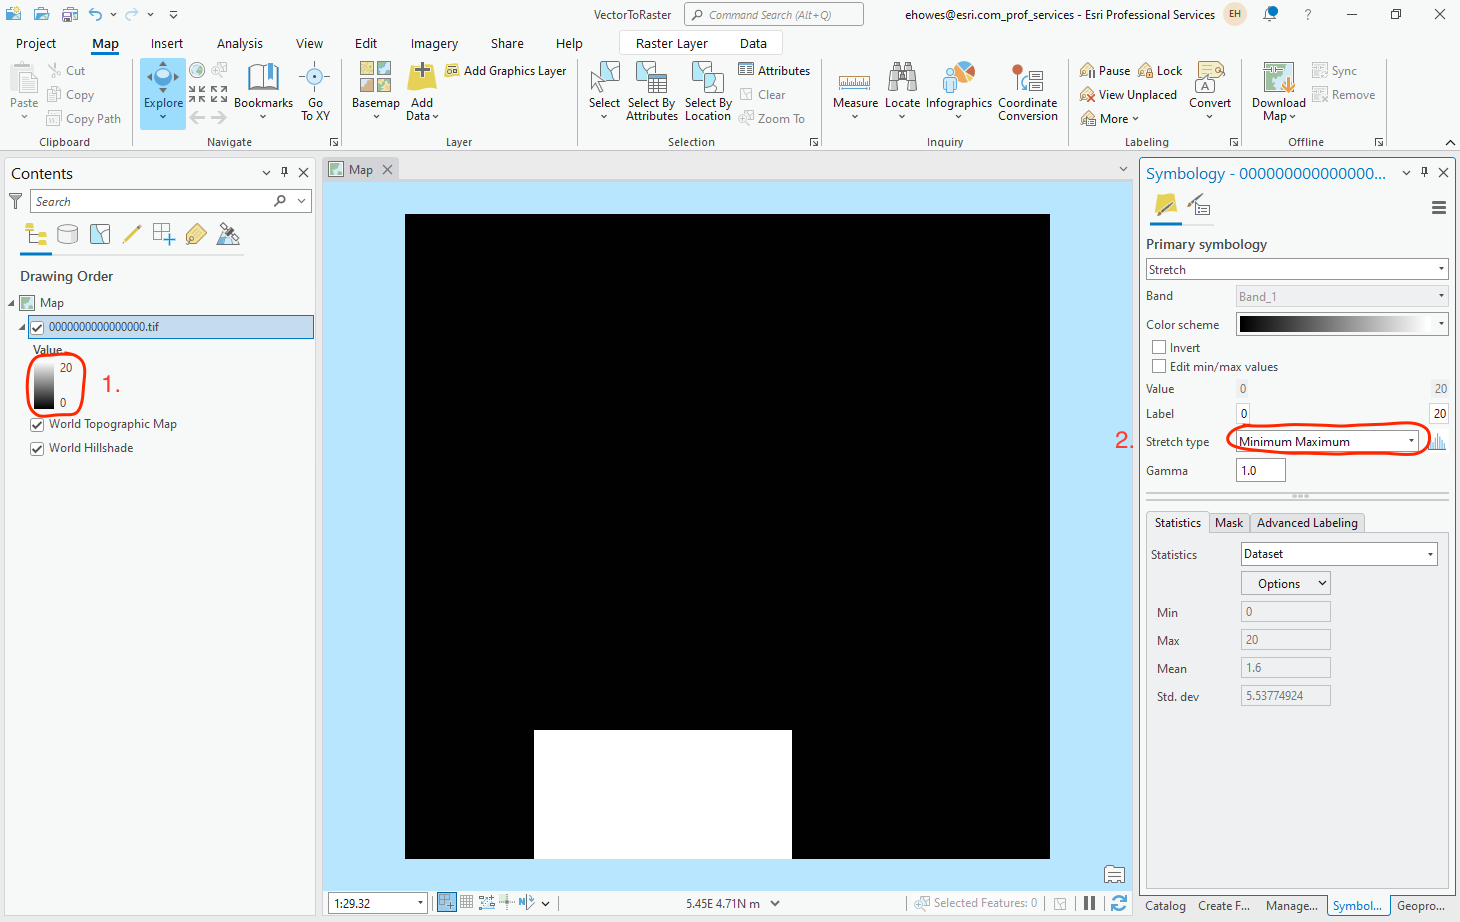
To get the tif to display properly visually, you may need to change the symbology of the tif:
Select the Value colors in the contents page to open the Primary Symbology pane.
Here you can change the Stretch type to Minimum Maximum.
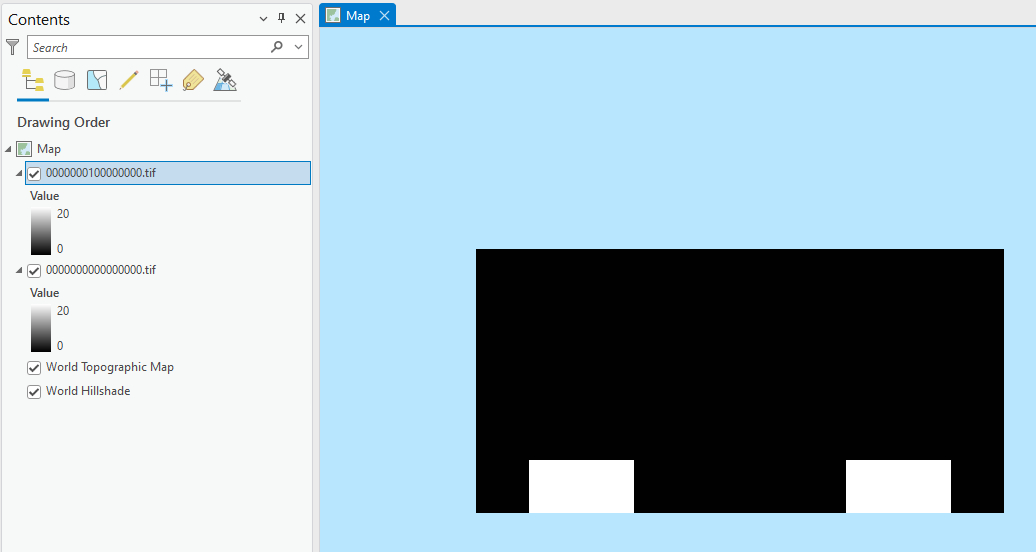
Repeat this process for the other tif files output for a particular desc by ProcessorVectorRaster.
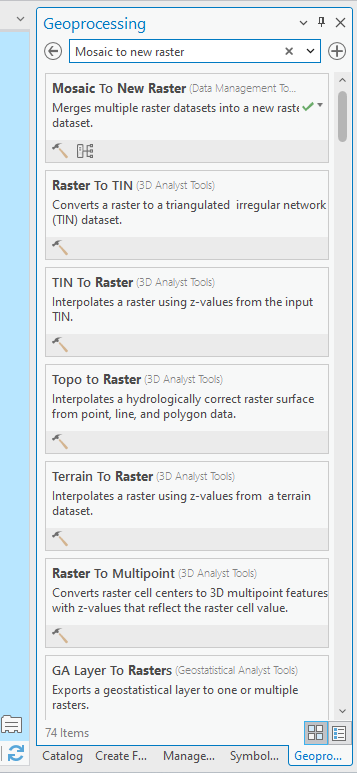
In the Geoprocessing tools pane, search for “Mosaic To New Raster” and select it.
Select your raster tifs as Input Rasters to stitch together
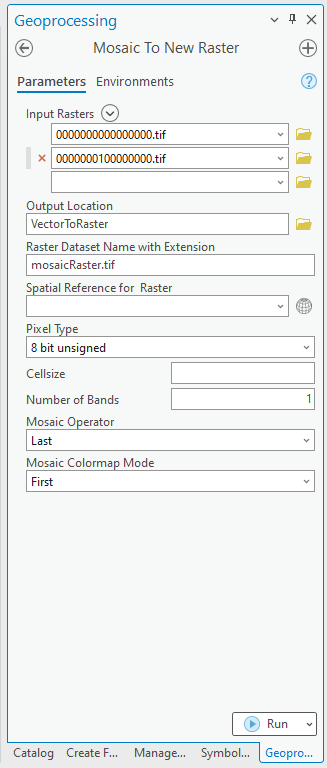
Run the Mosaic To New Raster tool and it will create a new raster dataset with the input tif files combined.