ST_Distance#
Table of Contents#
[ ]:
import bdt
bdt.auth("bdt.lic")
from bdt.functions import *
from pyspark.sql.functions import *
from bdt.processors import *
import geopandas
import folium
import mapclassify
import matplotlib
BDT has been successfully authorized!

            Welcome to
             ___    _                ___         __             ______             __   __     _   __
            / _ )  (_)  ___ _       / _ \ ___ _ / /_ ___ _     /_  __/ ___  ___   / /  / /__  (_) / /_
           / _  | / /  / _ `/      / // // _ `// __// _ `/      / /   / _ \/ _ \ / /  /  '_/ / / / __/
          /____/ /_/   \_, /      /____/ \_,_/ \__/ \_,_/      /_/    \___/\___//_/  /_/\_\ /_/  \__/
                      /___/

BDT python version: v3.5.0-v3.5.0
BDT jar version: v3.5.0-v3.5.0
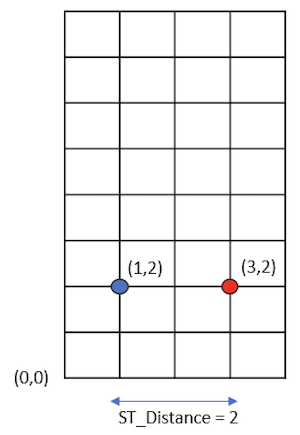
Part 1: What is ST_Distance#
ST_Distance calculates the 2D planar distance between two shape structs. It will work with any geometry as long as the data has two shape columns.
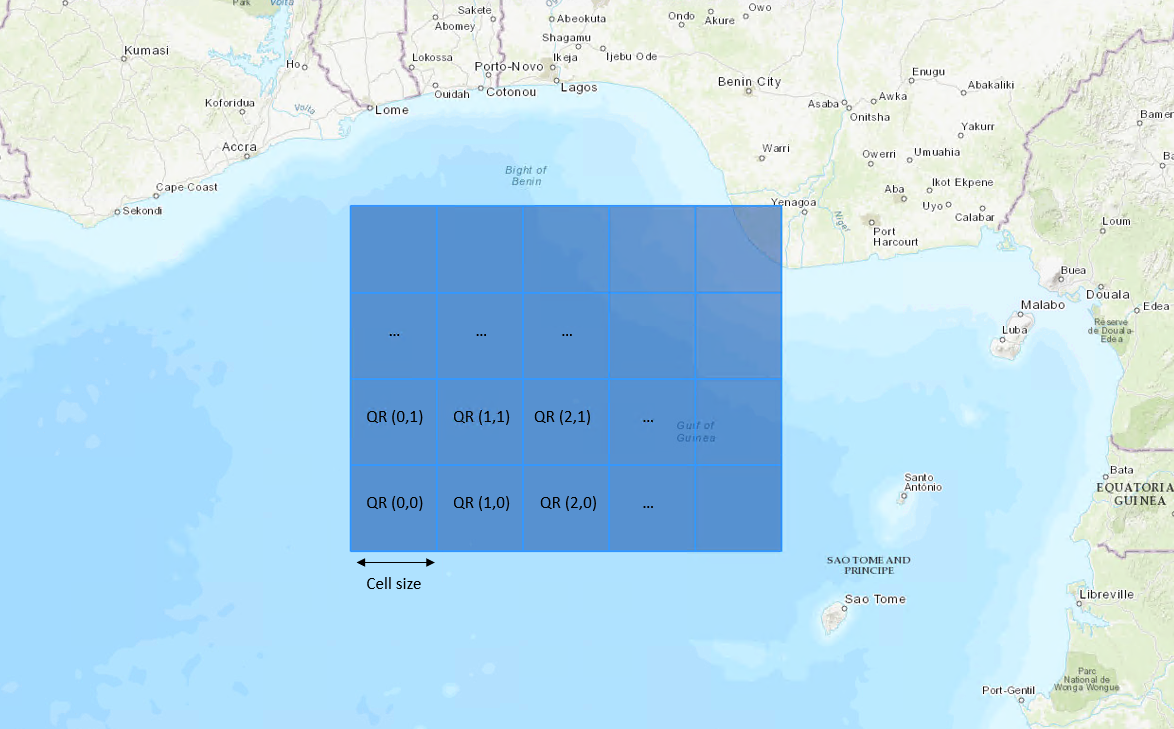
QR Spatial Partitioning#
QR is the spatial partitioning system for BDT. Think of QR as a large grid of cells overlayed on a map.
QR allows BDT to split large geospatial data into partitions. BDT can use these partitions to leverage Spark for parallel processing.
By using partitions and parallel processing, this results in a performance boost for ST_Distance calculations.
Part 2: ST_Distance Input Data#
Use Spark to read in 2 sample parquet dataframes with points around the Esri Redlands campus.
[ ]:
points_df1 = spark.read.parquet("abfss://integration@bdtcicd.dfs.core.windows.net/sampleNotebooks/data/stdist_samplepoints1.parquet")
points_df1.show()
+---+--------------------+
|ID1|              SHAPE1|
+---+--------------------+
|  1|{[01 01 00 00 00 ...|
|  2|{[01 01 00 00 00 ...|
|  3|{[01 01 00 00 00 ...|
|  4|{[01 01 00 00 00 ...|
|  5|{[01 01 00 00 00 ...|
|  6|{[01 01 00 00 00 ...|
|  7|{[01 01 00 00 00 ...|
|  8|{[01 01 00 00 00 ...|
|  9|{[01 01 00 00 00 ...|
| 10|{[01 01 00 00 00 ...|
+---+--------------------+
[ ]:
points_df2 = spark.read.parquet("abfss://integration@bdtcicd.dfs.core.windows.net/sampleNotebooks/data/stdist_samplepoints2.parquet")
points_df2.show()
+---+--------------------+
|ID2|              SHAPE2|
+---+--------------------+
|  1|{[01 01 00 00 00 ...|
|  2|{[01 01 00 00 00 ...|
|  3|{[01 01 00 00 00 ...|
|  4|{[01 01 00 00 00 ...|
|  5|{[01 01 00 00 00 ...|
|  6|{[01 01 00 00 00 ...|
|  7|{[01 01 00 00 00 ...|
|  8|{[01 01 00 00 00 ...|
|  9|{[01 01 00 00 00 ...|
| 10|{[01 01 00 00 00 ...|
+---+--------------------+
Explore Points#
This function allows quick visualizations of Spark dataframes using geopandas and folium.
The function uses to_geo_pandas to convert the spark df to a geopandas df for visualization
[ ]:
def explore_points(df1, df2):
    gdf1 = df1.to_geo_pandas(102010, "SHAPE1")
    gdf2 = df2.to_geo_pandas(102010, "SHAPE2")

    m = gdf2.explore(legend=False, color="red", tiles="Esri.WorldTopoMap")
    m = gdf1.explore(legend=False, color="blue", m=m)
    folium.LayerControl().add_to(m)
    return m
[ ]:
explore_points(points_df1, points_df2)
ST_AsQR#
Use the ST_AsQR function which spatially partitions the data into QR cells with a given cell size. It returns an array of cells but use explode() to unpack it.
Use 350m for the cell size for this example.
The cell size will need to be in units of the spatial reference.
[ ]:
pointsQR_df1 = points_df1.select("*", explode(st_asQR("SHAPE1", 350)).alias("QR"))
pointsQR_df1.show()
+---+--------------------+---------------+
|ID1|              SHAPE1|             QR|
+---+--------------------+---------------+
|  1|{[01 01 00 00 00 ...|-22561463207158|
|  2|{[01 01 00 00 00 ...|-22557168239862|
|  3|{[01 01 00 00 00 ...|-22557168239862|
|  4|{[01 01 00 00 00 ...|-22557168239862|
|  5|{[01 01 00 00 00 ...|-22557168239862|
|  6|{[01 01 00 00 00 ...|-22552873272566|
|  7|{[01 01 00 00 00 ...|-22552873272566|
|  8|{[01 01 00 00 00 ...|-22552873272566|
|  9|{[01 01 00 00 00 ...|-22552873272566|
| 10|{[01 01 00 00 00 ...|-22552873272566|
+---+--------------------+---------------+
[ ]:
pointsQR_df2 = points_df2.select("*", explode(st_asQR("SHAPE2", 350)).alias("QR"))
pointsQR_df2.show()
+---+--------------------+---------------+
|ID2|              SHAPE2|             QR|
+---+--------------------+---------------+
|  1|{[01 01 00 00 00 ...|-22561463207158|
|  2|{[01 01 00 00 00 ...|-22557168239862|
|  3|{[01 01 00 00 00 ...|-22557168239862|
|  4|{[01 01 00 00 00 ...|-22557168239862|
|  5|{[01 01 00 00 00 ...|-22552873272566|
|  6|{[01 01 00 00 00 ...|-22552873272566|
|  7|{[01 01 00 00 00 ...|-22552873272566|
|  8|{[01 01 00 00 00 ...|-22552873272566|
|  9|{[01 01 00 00 00 ...|-22552873272566|
| 10|{[01 01 00 00 00 ...|-22552873272566|
+---+--------------------+---------------+
ST_QR_To_Box#
Each QR cell has an id but no shape information. For visulization purposes folium and geopandas require shape data.
Use the ST_QR_To_Box function to extract the shape metadata for each of the QR cells.
[ ]:
pointsQR_df1 = pointsQR_df1.select("*", st_qr_to_box("QR", 350, 0).alias("BOX"))
pointsQR_df1.show()
+---+--------------------+---------------+--------------------+
|ID1|              SHAPE1|             QR|                 BOX|
+---+--------------------+---------------+--------------------+
|  1|{[01 01 00 00 00 ...|-22561463207158|{[01 03 00 00 00 ...|
|  2|{[01 01 00 00 00 ...|-22557168239862|{[01 03 00 00 00 ...|
|  3|{[01 01 00 00 00 ...|-22557168239862|{[01 03 00 00 00 ...|
|  4|{[01 01 00 00 00 ...|-22557168239862|{[01 03 00 00 00 ...|
|  5|{[01 01 00 00 00 ...|-22557168239862|{[01 03 00 00 00 ...|
|  6|{[01 01 00 00 00 ...|-22552873272566|{[01 03 00 00 00 ...|
|  7|{[01 01 00 00 00 ...|-22552873272566|{[01 03 00 00 00 ...|
|  8|{[01 01 00 00 00 ...|-22552873272566|{[01 03 00 00 00 ...|
|  9|{[01 01 00 00 00 ...|-22552873272566|{[01 03 00 00 00 ...|
| 10|{[01 01 00 00 00 ...|-22552873272566|{[01 03 00 00 00 ...|
+---+--------------------+---------------+--------------------+
[ ]:
pointsQR_df2 = pointsQR_df2.select("*", st_qr_to_box("QR", 350, 0).alias("BOX"))
pointsQR_df2.show()
+---+--------------------+---------------+--------------------+
|ID2|              SHAPE2|             QR|                 BOX|
+---+--------------------+---------------+--------------------+
|  1|{[01 01 00 00 00 ...|-22561463207158|{[01 03 00 00 00 ...|
|  2|{[01 01 00 00 00 ...|-22557168239862|{[01 03 00 00 00 ...|
|  3|{[01 01 00 00 00 ...|-22557168239862|{[01 03 00 00 00 ...|
|  4|{[01 01 00 00 00 ...|-22557168239862|{[01 03 00 00 00 ...|
|  5|{[01 01 00 00 00 ...|-22552873272566|{[01 03 00 00 00 ...|
|  6|{[01 01 00 00 00 ...|-22552873272566|{[01 03 00 00 00 ...|
|  7|{[01 01 00 00 00 ...|-22552873272566|{[01 03 00 00 00 ...|
|  8|{[01 01 00 00 00 ...|-22552873272566|{[01 03 00 00 00 ...|
|  9|{[01 01 00 00 00 ...|-22552873272566|{[01 03 00 00 00 ...|
| 10|{[01 01 00 00 00 ...|-22552873272566|{[01 03 00 00 00 ...|
+---+--------------------+---------------+--------------------+
Explore Points with QR#
This function works the same as explore_points but allows visualization of QR cells and points.
[ ]:
def explore_points_withQR(df1, df2):
    gdf1 = df1.select("SHAPE1", "QR").to_geo_pandas(102010, "SHAPE1")
    gdf1_grid = df1.select("BOX", "QR").to_geo_pandas(102010, "BOX")

    gdf2 = df2.select("SHAPE2", "QR").to_geo_pandas(102010, "SHAPE2")
    gdf2_grid = df2.select("BOX", "QR").to_geo_pandas(102010, "BOX")

    m = gdf2.explore(legend=False, color="red", tiles="Esri.WorldTopoMap")
    m = gdf1.explore(legend=False, color="blue", m=m)
    m = gdf2_grid.explore(legend=False, color="grey", style_kwds=dict(fillOpacity=.04), m=m)
    m = gdf1_grid.explore(legend=False, color="grey", style_kwds=dict(fillOpacity=.04), m=m)
    folium.LayerControl().add_to(m)
    return m
[ ]:
explore_points_withQR(pointsQR_df1, pointsQR_df2)
Part 3: Using ST_Distance#
Spark has a “share nothing” philsophy where data is not shared between partitions.
In the example above, the points in the far left QR cell will not be able to “see” the other points in the two other QR partitions.
The St_AsQRSpill function solves this by “spilling” or duplicating points into neighboring QR partitions.
ST_Distance implicitly requires a maximum distance beyond which two points will not find a distance between each other.
ST_AsQRSpill requires a radius that must be at least as large as the maximum distance. Usually, the radius is the same value as the maximum distance. The max distance value, and therefore radius, is set to 700 meters for this example.
The spill radius size will need to be in units of the spatial reference.
[ ]:
spilldf1 = pointsQR_df1.select("ID1", "SHAPE1", explode(st_asQRSpill("SHAPE1", 350, 700)).alias("QRSpill"))
spilldf1.show()
+---+--------------------+---------------+
|ID1|              SHAPE1|        QRSpill|
+---+--------------------+---------------+
|  1|{[01 01 00 00 00 ...|-22570053141752|
|  1|{[01 01 00 00 00 ...|-22565758174456|
|  1|{[01 01 00 00 00 ...|-22561463207160|
|  1|{[01 01 00 00 00 ...|-22557168239864|
|  1|{[01 01 00 00 00 ...|-22552873272568|
|  1|{[01 01 00 00 00 ...|-22570053141751|
|  1|{[01 01 00 00 00 ...|-22565758174455|
|  1|{[01 01 00 00 00 ...|-22561463207159|
|  1|{[01 01 00 00 00 ...|-22557168239863|
|  1|{[01 01 00 00 00 ...|-22552873272567|
|  1|{[01 01 00 00 00 ...|-22570053141750|
|  1|{[01 01 00 00 00 ...|-22565758174454|
|  1|{[01 01 00 00 00 ...|-22561463207158|
|  1|{[01 01 00 00 00 ...|-22557168239862|
|  1|{[01 01 00 00 00 ...|-22552873272566|
|  1|{[01 01 00 00 00 ...|-22570053141749|
|  1|{[01 01 00 00 00 ...|-22565758174453|
|  1|{[01 01 00 00 00 ...|-22561463207157|
|  1|{[01 01 00 00 00 ...|-22557168239861|
|  1|{[01 01 00 00 00 ...|-22552873272565|
+---+--------------------+---------------+
only showing top 20 rows
[ ]:
spilldf2 = pointsQR_df2.select("ID2", "SHAPE2", explode(st_asQRSpill("SHAPE2", 350, 700)).alias("QRSpill"))
spilldf2.show()
+---+--------------------+---------------+
|ID2|              SHAPE2|        QRSpill|
+---+--------------------+---------------+
|  1|{[01 01 00 00 00 ...|-22570053141752|
|  1|{[01 01 00 00 00 ...|-22565758174456|
|  1|{[01 01 00 00 00 ...|-22561463207160|
|  1|{[01 01 00 00 00 ...|-22557168239864|
|  1|{[01 01 00 00 00 ...|-22552873272568|
|  1|{[01 01 00 00 00 ...|-22570053141751|
|  1|{[01 01 00 00 00 ...|-22565758174455|
|  1|{[01 01 00 00 00 ...|-22561463207159|
|  1|{[01 01 00 00 00 ...|-22557168239863|
|  1|{[01 01 00 00 00 ...|-22552873272567|
|  1|{[01 01 00 00 00 ...|-22570053141750|
|  1|{[01 01 00 00 00 ...|-22565758174454|
|  1|{[01 01 00 00 00 ...|-22561463207158|
|  1|{[01 01 00 00 00 ...|-22557168239862|
|  1|{[01 01 00 00 00 ...|-22552873272566|
|  1|{[01 01 00 00 00 ...|-22570053141749|
|  1|{[01 01 00 00 00 ...|-22565758174453|
|  1|{[01 01 00 00 00 ...|-22561463207157|
|  1|{[01 01 00 00 00 ...|-22557168239861|
|  1|{[01 01 00 00 00 ...|-22552873272565|
+---+--------------------+---------------+
only showing top 20 rows
Lower Left#
There is still one last issue, point pairs are duplicated across QRs after the spill.
The ST_isLowerLeftInCell function solves this issue and eliminates duplicates.
Join the DFs together and then use ST_isLowerLeftInCell to filter out duplicates. This will improve performance by removing redundant calculations.
Make sure the cell size is matching the previous function calls, in this example we use 350m.
The cell size will need to be in units of the spatial reference.
[ ]:
spilldf = spilldf1.join(spilldf2, "QRSpill")
spilldf.show()
+---------------+---+--------------------+---+--------------------+
|        QRSpill|ID1|              SHAPE1|ID2|              SHAPE2|
+---------------+---+--------------------+---+--------------------+
|-22570053141752|  1|{[01 01 00 00 00 ...|  1|{[01 01 00 00 00 ...|
|-22565758174456|  5|{[01 01 00 00 00 ...|  1|{[01 01 00 00 00 ...|
|-22565758174456|  4|{[01 01 00 00 00 ...|  1|{[01 01 00 00 00 ...|
|-22565758174456|  3|{[01 01 00 00 00 ...|  1|{[01 01 00 00 00 ...|
|-22565758174456|  2|{[01 01 00 00 00 ...|  1|{[01 01 00 00 00 ...|
|-22565758174456|  1|{[01 01 00 00 00 ...|  1|{[01 01 00 00 00 ...|
|-22561463207160| 10|{[01 01 00 00 00 ...|  1|{[01 01 00 00 00 ...|
|-22561463207160|  9|{[01 01 00 00 00 ...|  1|{[01 01 00 00 00 ...|
|-22561463207160|  8|{[01 01 00 00 00 ...|  1|{[01 01 00 00 00 ...|
|-22561463207160|  7|{[01 01 00 00 00 ...|  1|{[01 01 00 00 00 ...|
|-22561463207160|  6|{[01 01 00 00 00 ...|  1|{[01 01 00 00 00 ...|
|-22561463207160|  5|{[01 01 00 00 00 ...|  1|{[01 01 00 00 00 ...|
|-22561463207160|  4|{[01 01 00 00 00 ...|  1|{[01 01 00 00 00 ...|
|-22561463207160|  3|{[01 01 00 00 00 ...|  1|{[01 01 00 00 00 ...|
|-22561463207160|  2|{[01 01 00 00 00 ...|  1|{[01 01 00 00 00 ...|
|-22561463207160|  1|{[01 01 00 00 00 ...|  1|{[01 01 00 00 00 ...|
|-22557168239864| 10|{[01 01 00 00 00 ...|  1|{[01 01 00 00 00 ...|
|-22557168239864|  9|{[01 01 00 00 00 ...|  1|{[01 01 00 00 00 ...|
|-22557168239864|  8|{[01 01 00 00 00 ...|  1|{[01 01 00 00 00 ...|
|-22557168239864|  7|{[01 01 00 00 00 ...|  1|{[01 01 00 00 00 ...|
+---------------+---+--------------------+---+--------------------+
only showing top 20 rows
[ ]:
lower_df = spilldf \
                    .select("*", st_isLowerLeftInCell("QRSPILL", 350, "SHAPE1", "SHAPE2").alias("LOWER_LEFT")) \
                    .filter(col("LOWER_LEFT") == True)
lower_df.show()
+---------------+---+--------------------+---+--------------------+----------+
|        QRSpill|ID1|              SHAPE1|ID2|              SHAPE2|LOWER_LEFT|
+---------------+---+--------------------+---+--------------------+----------+
|-22561463207158|  1|{[01 01 00 00 00 ...|  1|{[01 01 00 00 00 ...|      true|
|-22557168239862|  5|{[01 01 00 00 00 ...|  1|{[01 01 00 00 00 ...|      true|
|-22557168239862|  4|{[01 01 00 00 00 ...|  1|{[01 01 00 00 00 ...|      true|
|-22557168239862|  3|{[01 01 00 00 00 ...|  1|{[01 01 00 00 00 ...|      true|
|-22557168239862|  2|{[01 01 00 00 00 ...|  1|{[01 01 00 00 00 ...|      true|
|-22552873272566| 10|{[01 01 00 00 00 ...|  1|{[01 01 00 00 00 ...|      true|
|-22552873272566|  9|{[01 01 00 00 00 ...|  1|{[01 01 00 00 00 ...|      true|
|-22552873272566|  8|{[01 01 00 00 00 ...|  1|{[01 01 00 00 00 ...|      true|
|-22552873272566|  7|{[01 01 00 00 00 ...|  1|{[01 01 00 00 00 ...|      true|
|-22552873272566|  6|{[01 01 00 00 00 ...|  1|{[01 01 00 00 00 ...|      true|
|-22557168239862|  5|{[01 01 00 00 00 ...|  2|{[01 01 00 00 00 ...|      true|
|-22557168239862|  4|{[01 01 00 00 00 ...|  2|{[01 01 00 00 00 ...|      true|
|-22557168239862|  3|{[01 01 00 00 00 ...|  2|{[01 01 00 00 00 ...|      true|
|-22557168239862|  2|{[01 01 00 00 00 ...|  2|{[01 01 00 00 00 ...|      true|
|-22557168239862|  1|{[01 01 00 00 00 ...|  2|{[01 01 00 00 00 ...|      true|
|-22552873272566| 10|{[01 01 00 00 00 ...|  2|{[01 01 00 00 00 ...|      true|
|-22552873272566|  9|{[01 01 00 00 00 ...|  2|{[01 01 00 00 00 ...|      true|
|-22552873272566|  8|{[01 01 00 00 00 ...|  2|{[01 01 00 00 00 ...|      true|
|-22552873272566|  7|{[01 01 00 00 00 ...|  2|{[01 01 00 00 00 ...|      true|
|-22552873272566|  6|{[01 01 00 00 00 ...|  2|{[01 01 00 00 00 ...|      true|
+---------------+---+--------------------+---+--------------------+----------+
only showing top 20 rows
[ ]:
print(spilldf.count())
print(lower_df.count())
2160
100
Now that duplicates have been dropped, use ST_Distance to find the distance between the two shape columns.
[ ]:
dist_df = lower_df.select("ID1", "SHAPE1", "ID2", "SHAPE2", st_distance("SHAPE1", "SHAPE2").alias("DISTANCE"))
dist_df.show()
+---+--------------------+---+--------------------+------------------+
|ID1|              SHAPE1|ID2|              SHAPE2|          DISTANCE|
+---+--------------------+---+--------------------+------------------+
|  1|{[01 01 00 00 00 ...|  1|{[01 01 00 00 00 ...| 22.05351509650208|
|  5|{[01 01 00 00 00 ...|  1|{[01 01 00 00 00 ...| 377.6870665209558|
|  4|{[01 01 00 00 00 ...|  1|{[01 01 00 00 00 ...| 306.2557307245356|
|  3|{[01 01 00 00 00 ...|  1|{[01 01 00 00 00 ...|175.36347718712253|
|  2|{[01 01 00 00 00 ...|  1|{[01 01 00 00 00 ...| 103.6666322290531|
| 10|{[01 01 00 00 00 ...|  1|{[01 01 00 00 00 ...| 624.0200847189299|
|  9|{[01 01 00 00 00 ...|  1|{[01 01 00 00 00 ...| 537.7454789310219|
|  8|{[01 01 00 00 00 ...|  1|{[01 01 00 00 00 ...| 463.4790586395471|
|  7|{[01 01 00 00 00 ...|  1|{[01 01 00 00 00 ...| 416.5939624771204|
|  6|{[01 01 00 00 00 ...|  1|{[01 01 00 00 00 ...|403.88843731793094|
|  5|{[01 01 00 00 00 ...|  2|{[01 01 00 00 00 ...|330.93397659075697|
|  4|{[01 01 00 00 00 ...|  2|{[01 01 00 00 00 ...| 245.4150297876873|
|  3|{[01 01 00 00 00 ...|  2|{[01 01 00 00 00 ...|129.48849623114972|
|  2|{[01 01 00 00 00 ...|  2|{[01 01 00 00 00 ...| 57.72625700616164|
|  1|{[01 01 00 00 00 ...|  2|{[01 01 00 00 00 ...| 67.42295339385814|
| 10|{[01 01 00 00 00 ...|  2|{[01 01 00 00 00 ...|  569.942761083593|
|  9|{[01 01 00 00 00 ...|  2|{[01 01 00 00 00 ...| 471.8627724186483|
|  8|{[01 01 00 00 00 ...|  2|{[01 01 00 00 00 ...| 415.4562271384083|
|  7|{[01 01 00 00 00 ...|  2|{[01 01 00 00 00 ...| 348.8566445153556|
|  6|{[01 01 00 00 00 ...|  2|{[01 01 00 00 00 ...| 333.5272091115894|
+---+--------------------+---+--------------------+------------------+
only showing top 20 rows
Sort by distance to get the greatest distance between points.
Then use the explore function again to visualize these points.
[ ]:
sorted_df = dist_df.orderBy(desc("DISTANCE"))
max_dist = sorted_df.limit(1)
max_dist.show()
+---+--------------------+---+--------------------+-----------------+
|ID1|              SHAPE1|ID2|              SHAPE2|         DISTANCE|
+---+--------------------+---+--------------------+-----------------+
|  1|{[01 01 00 00 00 ...| 10|{[01 01 00 00 00 ...|679.2010843920712|
+---+--------------------+---+--------------------+-----------------+
[ ]:
p1 = max_dist.select("ID1", "SHAPE1", "DISTANCE")
p2 = max_dist.select("ID2", "SHAPE2", "DISTANCE")
[ ]:
explore_points(p1, p2)